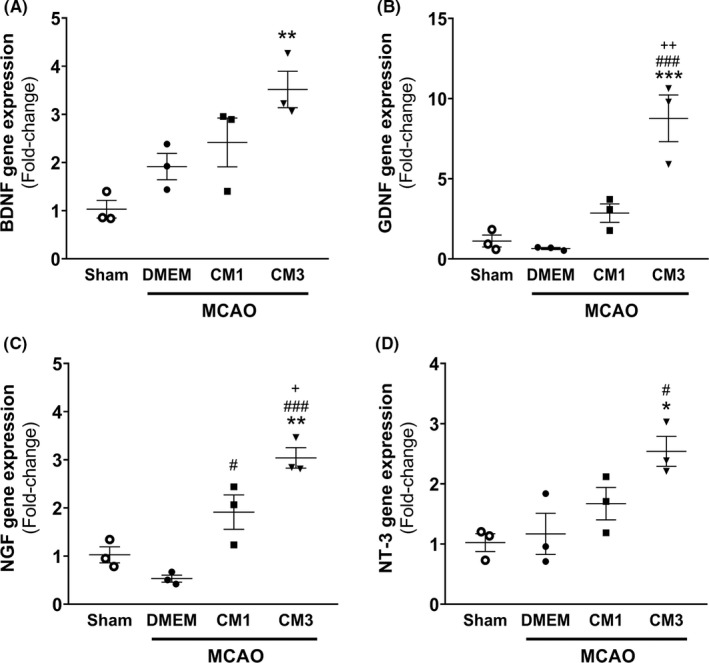
FIGURE 5.

Effect of hESC‐MSC‐CM on mRNA levels of neurotrophic factors. qPCR data analysis of (A) BDNF, (B) GDNF, (C) NGF, and (D) NT‐3 in the hippocampus. Data are reported as the mean ± SEM (n = 3). The differences between groups were determined by ANOVA followed by Tukey test. *p < 0.05, **p < 0.01 and ***p < 0.001 vs. Sham, # p < 0.05 and ### p < 0.001 vs. MCAO+DMEM, + p < 0.05 and ++ p < 0.01 vs. CM1. CM, conditioned medium; DMEM, Dulbecco's modified eagle's medium; MCAO, middle cerebral artery occlusion; BDNF, brain‐derived neurotrophic factor; GDNF, glial cell‐derived neurotrophic factor; NGF, nerve growth factor; NT‐3, neurotrophin‐3
