
Fig. 3.
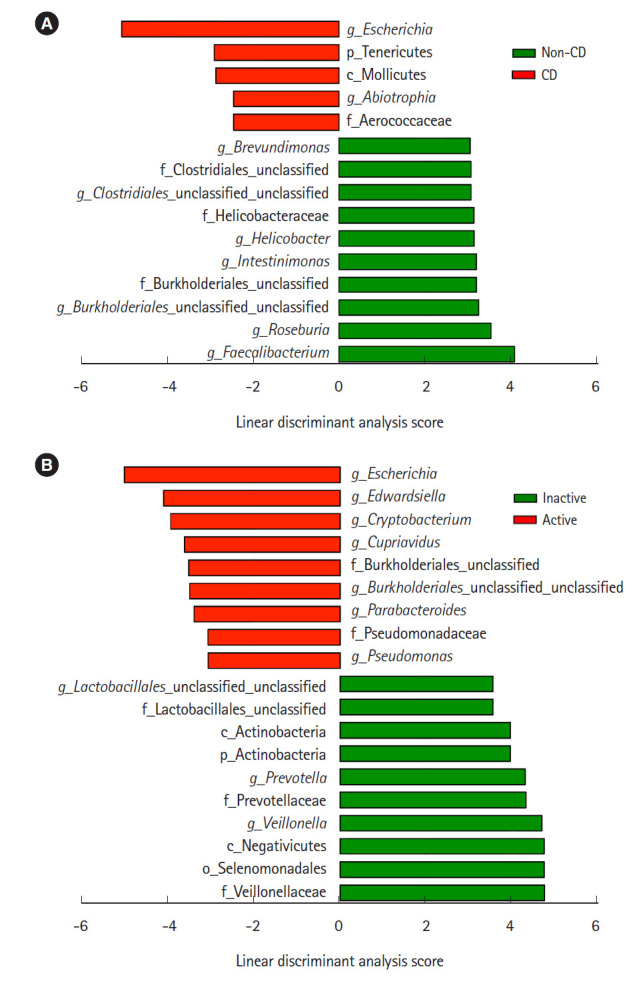
Comparative analysis of the taxonomic composition of the microbial community at the genus level using linear discriminant analysis effect size. (A) Comparison between non-CD (n=9) and CD samples (n=27). (B) Comparison between inactive (n=18) and active lesions (n=9) of CD patients. CD, Crohn’s disease.