


This cohort study investigates the association of newborn screening for cystic fibrosis with child outcomes up to age 10 years in the US.
Key Points
Question
In the US, is newborn screening (NBS) for cystic fibrosis (CF) associated with improved outcomes up to age 10 years?
Findings
In this national cohort study of 9574 participants, children with CF born after implementation of NBS for CF in their state of birth had significantly greater weight and height percentiles and lower hazard of chronic infection with Pseudomonas aeruginosa compared with those born pre-NBS. Lung function was not significantly different between the 2 cohorts.
Meaning
NBS for CF in the US is associated with improved nutritional status and lower risk of chronic Pseudomonas infection; there is no clear association with lung function up to age 10 years.
Abstract
Importance
Newborn screening (NBS) for cystic fibrosis (CF) has been universal in the US since 2010, but its association with clinical outcomes is unclear.
Objective
To describe the real-world effectiveness of NBS programs for CF in the US on outcomes up to age 10 years.
Design, Setting, and Participants
This was a retrospective cohort study using CF Foundation Patient Registry data from January 1, 2000, to December 31, 2018. The staggered implementation of NBS programs by state was used to compare longitudinal outcomes among children in the same birth cohort born before vs after the implementation of NBS for CF in their state of birth. Participants included children with an established diagnosis of CF born between January 1, 2000, to December 31, 2018, in any of the 44 states that implemented NBS for CF between 2003 and 2010. Data were analyzed from October 5, 2020, to April 22, 2022.
Exposures
Birth before vs after the implementation of NBS for CF in the state of birth.
Main Outcomes and Measures
Longitudinal trajectory of height and weight percentiles from diagnosis, lung function (forced expiratory volume in 1 second, [FEV1] percent predicted) from age 6 years, and age at initial and chronic infection with Pseudomonas aeruginosa using linear mixed-effects and time-to-event models adjusting for birth cohort and potential confounders.
Results
A total of 9571 participants (4713 female participants [49.2%]) were eligible for inclusion, with 4510 (47.1%) in the pre-NBS cohort. NBS was associated with higher weight and height percentiles in the first year of life (weight, 6.0; 95% CI, 3.1-8.4; height, 6.6; 95% CI, 3.8-9.3), but these differences decreased with age. There was no association between NBS and FEV1 at age 6 years, but the percent-predicted FEV1 did increase more rapidly with age in the post-NBS cohort. NBS was associated with older age at chronic P aeruginosa infection (hazard ratio, 0.69; 95% CI, 0.54-0.89) but not initial P aeruginosa infection (hazard ratio, 0.88; 95% CI, 0.77-1.01).
Conclusions and Relevance
NBS for CF in the US was associated with improved nutritional status up to age 10 years, a more rapid increase in lung function, and delayed chronic P aeruginosa infection. In the future, as highly effective modulator therapies become available for infants with CF, NBS will allow for presymptomatic initiation of these disease-modifying therapies before irreversible organ damage.
Introduction
The goal of newborn screening (NBS) is to detect diseases in the neonatal period to intervene early and improve long-term outcomes. In the US, NBS is implemented by each state based on the federal uniform guidelines for state NBS programs.1 As a result, all states today screen for at least 29 conditions. Currently, approximately 4 million infants are screened annually, and 12 500 are identified as having one of these conditions.2 The public health benefits of NBS are well recognized.3
Cystic fibrosis (CF), a life-shortening, monogenic, autosomal-recessive disorder, has an estimated incidence of 1:2500 to 1:3500 live births.4 NBS for CF has been widely adopted in many European countries, Australia, New Zealand, Canada, and the US. In the US, NBS for CF began in Colorado in 1982, was added to the Recommended Uniform Screening Panel in 2006, and was expanded to all 50 states by 2010. A landmark randomized controlled trial of NBS for CF in Wisconsin that began in the 1980s showed improved nutritional outcomes associated with NBS but no positive effect on pulmonary outcomes.5 Since that time, CF care and outcomes have improved substantially. On the 10th anniversary of universal NBS for CF in the US, we undertook a retrospective, longitudinal evaluation of nutritional and respiratory outcomes associated with NBS programs for CF. The staggered implementation of NBS for CF across US states between 2004 and 2009 created a natural experiment in which infants were exposed to NBS for CF or NBS that did not include CF, depending on their state and year of birth, allowing comparison of outcomes before and after the implementation of NBS for CF while adjusting for birth cohort to account for known secular improvements in CF care and outcomes.6,7 Our objective was to describe the real-world effectiveness of US NBS programs on clinical outcomes up to age 10 years. We hypothesized that NBS programs would be associated with at least short-term improvements in weight and height but that the association with lung function and acquisition of Pseudomonas aeruginosa (the sentinel pathogen in CF) would be less clear.
Methods
Data Source and Study Population
We used January 1, 2000, to December 31, 2018, data from the CF Foundation Patient Registry (CFFPR). As previously described,4 the CFFPR contains a wide array of demographic, diagnostic, and encounter-based clinical data on patients with CF monitored at CF Foundation–accredited care centers, representing approximately 84% of all US patients with CF. Written informed consent was obtained from each registry participant. Participant race categories included Black, White, and other (American Indian or Alaska Native, Asian, Native Hawaiian or Other Pacific Islander), and participant ethnicity categories included Hispanic and non-Hispanic. The CFF patient registry reports race and ethnicity to identify and understand the distribution of CFTR genetic variants among different populations. Eligibility for inclusion in the current cohort included (1) a diagnosis8 of CF before age 10 years and (2) birth between January 1, 2000, to December 31, 2018, in any of the 44 states and the District of Columbia that began statewide NBS programs in 2004 or later (listed in Figure 1). Exclusion criteria are included in the eMethods in the Supplement.
Figure 1. Consolidated Standards of Reporting Trials (CONSORT) Diagram and Year of Newborn Screening (NBS) Implementation.

A, The CONSORT diagram shows the number of participants for each study outcome presented along with the total participants excluded. B, NBS chart displays the year in which cystic fibrosis screening was initiated for each state. FEV1 indicates forced expiratory volume in the first second of expiration.
aStates excluded from analysis.
Study Design
We conducted a retrospective, observational cohort study evaluating longitudinal outcomes up to age 10 years among children born before vs after the implementation of NBS. The staggered implementation of NBS for CF across 44 US states between 2004 and 2009 mimics an observational (nonexperimental) stepped-wedge design.9 A stepped-wedge design is essentially a 1-way crossover study in which all clusters (in this case, the states) begin observation in a period of nonintervention, followed by a rollout period during which the number of clusters exposed to the intervention increases, and then ends with all clusters exposed to the intervention. In our study, the period 2000 to 2003 was the nonintervention period, 2004 to 2011 was the rollout period, and 2012 to 2018 was the period in which all states were exposed to the intervention. Given secular improvements in CF care and outcomes over the observation period, we endeavored to distinguish the association of NBS with these improvements by adjusting for birth cohort (steps), the grouped years of birth 2000 to 2003, 2004 to 2007, 2008 to 2011, and 2012 to 2018. This study was approved by the Advarra institutional review board and followed the Strengthening the Reporting of Observational Studies in Epidemiology (STROBE) reporting guidelines.
Exposure and Outcomes
As our objective was to evaluate the association of state NBS programs with outcomes, the main exposure was birth before or after implementation of NBS for CF in the state of birth rather than individual mode of diagnosis. Study outcomes included data from each clinic encounter (typically every 3 months) from diagnosis to age 10 years for (1) height and weight percentiles10,11; (2) spirometry (age ≥6 years), including forced expiratory volume in 1 second (FEV1), forced vital capacity (FVC), and FEV1/FVC expressed as percent predicted12; and (3) isolation of P aeruginosa from respiratory cultures.
Statistical Analysis
For each outcome, the median annualized value was plotted by age and NBS group. Associations between NBS and weight, height, and FEV1 were modeled with linear mixed-effects models,13 with birth cohort as a fixed effect, and random intercepts for participant (to account for repeated measures by participant) and state of birth (to account for unmeasured factors associated with state differences in NBS programs and CF care). Because NBS was not randomly allocated by state, we also adjusted for potential individual-level confounders: CFTR gene functional class,14 sex, and insurance status at diagnosis (as a proxy for socioeconomic status15). We evaluated the association of NBS programs with the hazard of incident and chronic16 P aeruginosa infection using a time-to-event approach.17,18 Further details are provided in the eMethods in the Supplement. Statistical analyses were conducted using SAS software, version 9.4 (SAS Institute). All P values were 2-sided, and a P value < .05 was considered significant. Data were analyzed from October 5, 2020, to April 22, 2022.
Results
Cohort Characteristics
A total of 9571 participants (4713 female participants [49.2%]; 4858 male participants [50.8%]) met eligibility criteria and constituted the cohort, with 4510 (47.1%) in the pre-NBS cohort. Included in the eligible cohort were participants from the following race and ethnicity categories: 386 Black (4.0%), 1038 Hispanic (10.8%), 8533 non-Hispanic (89.2%), 8912 White (93.1%), and 273 other race and ethnicity (2.9%) (Table 1). Figure 1 shows the participants available for analysis of each outcome; almost all participants contributed to the nutritional and P aeruginosa outcomes, whereas approximately one-third of participants were too young (age <6 years) to contribute to lung-function outcomes. Furthermore, although the number of lung-function measurements at each year of age between 6 and 10 years in the pre-NBS cohort ranged from 3766 to 4072, in the post-NBS cohort, the number decreased from 2200 at age 6 years to 537 at age 10 years because participants born recently did not achieve the age of 10 years during the study period (eFigure 1 in the Supplement).
Table 1. Cohort Characteristics.
| Variable | No. (%) | P value | |
|---|---|---|---|
| Pre-NBS (n = 4510) | Post-NBS (n = 5061) | ||
| Birth cohort | |||
| 2000-2003 | 2607 (57.8) | 0 | <.001 |
| 2004-2007 | 1796 (39.8) | 240 (4.7) | |
| 2008-2011 | 107 (2.4) | 2351 (46.5) | |
| 2012-2018 | 0 | 2470 (48.8) | |
| Sex | |||
| Female | 2258 (50.1) | 2455 (48.5) | .13 |
| Male | 2252 (49.9) | 2606 (51.5) | |
| Race | |||
| Black | 181 (4.0) | 205 (4.1) | .07 |
| White | 4219 (93.5) | 4693 (92.7) | |
| Othera | 110 (2.4) | 163 (3.2) | |
| Ethnicity | |||
| Hispanic | 465 (10.3) | 573 (11.3) | .12 |
| Non-Hispanic | 4045 (89.7) | 4488 (88.7) | |
| Insurance status in year of or year following diagnosis | |||
| Private | 2575 (57.1) | 2447 (48.4) | <.001 |
| Public | 1583 (35.1) | 2089 (41.3) | |
| None or missing | 352 (7.8) | 525 (10.4) | |
| CFTR functional classb | |||
| Minimal | 3676 (81.5) | 3710 (73.3) | <.001 |
| Residual | 220 (4.9) | 502 (9.9) | |
| Unknown or missing | 614 (13.6) | 849 (16.8) | |
| Participants with at least 1 F508del CFTR variant, % | 3930 (87.1) | 4377 (86.5) | .34 |
| Participants with meconium ileus, % | 1009 (22.4) | 698 (13.8) | <.001 |
| Age at diagnosis, median (IQR), mo | 4 (0-16) | 0 (0-1) | <.001 |
Abbreviation: NBS, newborn screening.
Other race included American Indian or Alaska Native, Asian, and Native Hawaiian or Other Pacific Islander.
Minimal function: both alleles class 1 to 3, residual function: at least 1 allele class 4 or 5.14
Compared with the pre-NBS cohort, the post-NBS cohort was born more recently (2012-2018: 2469 of 5059 children [48.8%] vs 0 children), had a slightly higher proportion of Hispanic children (572 of 5059 [11.3%] vs 459 of 4471 [10.3%]), a higher proportion with public insurance (2089 of 5059 [41.3%] vs 1581 of 4471 [35.4%]), and a greater proportion with residual function (milder) CFTR variants (501 of 5059 [9.9%] vs 215 of 4471 [4.8%]). Children with a homozygous deletion of phenylalanine at residue 508 (F508del) represented 51.6% participants in the pre-NBS cohort (2307 of 4471) and 46.9% participants (2373 of 5059) in the post-NBS cohort.
As expected, the post-NBS cohort had a substantially earlier median (IQR) age at diagnosis (0 [0-1]) months compared with the pre-NBS cohort (4 [0-16]) months (Table 1). To ensure equal follow-up in the cohorts born before and after NBS, we also evaluated age at diagnosis limiting the cohort to those with a full 10 years of follow-up. Among the pre-NBS cohort, 60% children (2725 of 4510) were diagnosed in the first 6 months of life and 71% (3200 of 4510) by age 1 year (eFigure 2 in the Supplement). In the post-NBS cohort, these proportions were 92% of children (613 of 664) and 94% (624 of 664), respectively. These substantial differences were observed when limiting the cohorts to those homozygous for F508del or with minimal function variants (eFigure 2 in the Supplement).
Association of NBS With Nutritional Outcomes
Median annualized weight and height percentiles were consistently higher in the post-NBS cohort. In the first year of life, these differences (post-NBS − pre-NBS) were 6.0 (95% CI, 3.1-8.4) for weight percentile and 6.6 (95% CI, 3.8-9.3) for height percentile. These differences persisted (though attenuated) through age 10 years (Figure 2). In longitudinal models, population-average weight and height were significantly greater in the post-NBS cohort and the difference decreased with age (Figure 2, Table 2). For example, the estimated mean difference in height percentile (post-NBS − pre-NBS) was 5.6 (95% CI, 2.8-8.4) at age 2 years, 3.7 (95% CI, 0.9-6.5) at age 6 years, and 1.8 (95% CI, −1.0 to 4.6) at age 10 years. For weight percentile, the estimated mean differences were 4.9 (95% CI, 2.3-7.6) at age 2 years, 3.4 (95% CI, 0.7-6.1) at age 6 years, and 1.8 (95% CI, −0.8 to 4.5) at age 10 years.
Figure 2. Association of Newborn Screening (NBS) With Observed Height and Weight Percentile and Forced Expiratory Volume in the First Second of Expiration (FEV1) Predicted by Age and on Marginal Mean Predictions From Mixed-Effects Models.
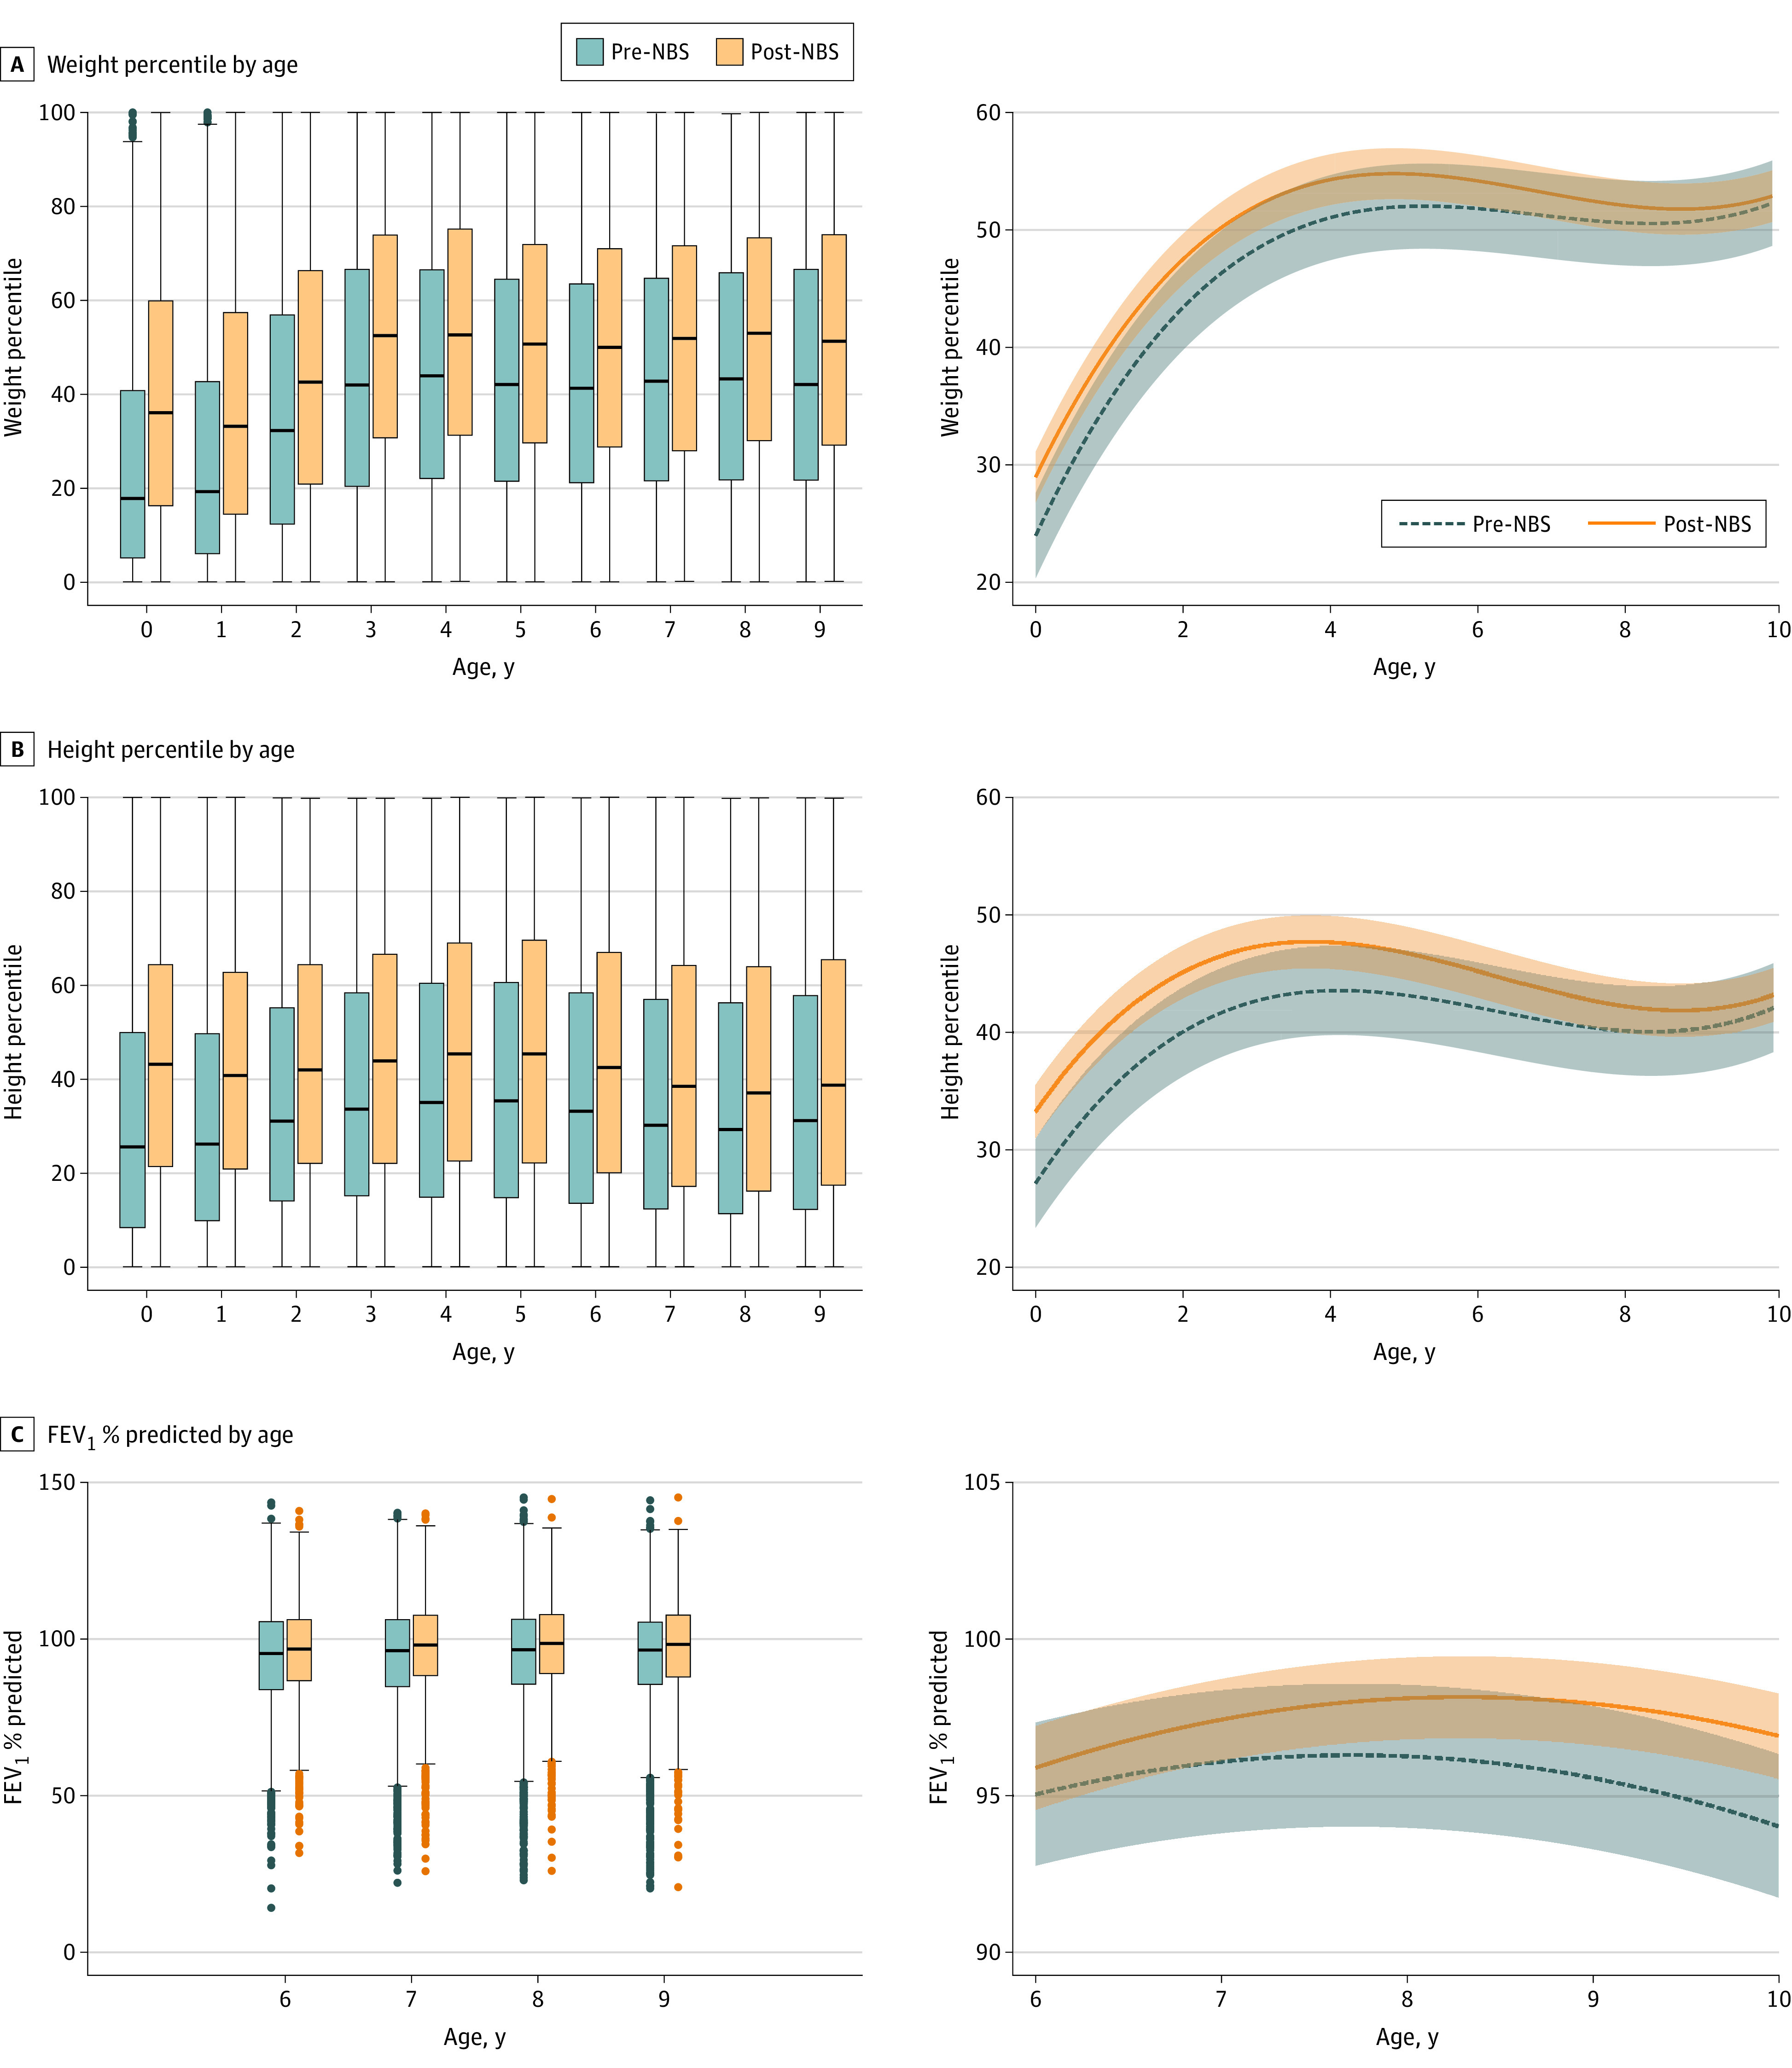
Box plots showing the distribution of observed data by age and the marginal mean prediction (and 95% CIs) between age and weight (A), height (B), and FEV1 (C) from linear mixed-effects models with random intercepts for state and child. Predictions and 95% CIs are weighted by the distribution of the other independent variables (ie, birth cohort, insurance, sex, CFTR functional class).
Table 2. Weight Percentile, Height Percentile, and FEV1 Percent Predicted: Parameter Estimates From Linear Mixed-Effects Models.
| Variable | Estimate (95% CI) | ||
|---|---|---|---|
| Weight percentile | Height percentile | FEV1% predicted | |
| (Intercept) | 29.1 (27.1 to 31.1) | 33.3 (31.3 to 35.4) | 95.9 (94.6 to 97.2) |
| Age | 12.5 (12.3 to 12.7) | 8.8 (8.6 to 8.9) | 2.0 (1.7 to 2.2) |
| Age2 | −2.0 (−2.0 to −1.9) | −1.7 (−1.7 to −1.6) | −0.4 (−0.5 to −0.4) |
| Age3 | 0.1 (0.1 to 0.1) | 0.1 (0.1 to 0.1) | NA |
| Born | |||
| Pre-NBS | Reference | Reference | Reference |
| Post-NBS implementation | 6.0 (3.1 to 8.4) | 6.6 (3.8 to 9.3) | 0.8 (−1.2 to 2.8) |
| Sex | |||
| Male | Reference | Reference | Reference |
| Female | −1.4 (−2.3 to −0.4) | 0.5 (−0.5 to 1.5) | −0.7 (−1.5 to 0.1) |
| Birth cohort | |||
| 2012-2018 | Reference | Reference | Reference |
| 2000-2003 | −5.7 (−8.7 to −2.8) | −3.3 (−6.4 to −0.3) | −1.6 (−3.8 to 0.6) |
| 2004-2007 | −3.1 (−6.0 to −0.2) | −0.9 (−4.0 to 2.1) | −0.4 (−2.4 to 1.5) |
| 2008-2011 | −1.0 (−2.5 to 0.6) | 0.7 (−0.9 to 2.3) | NA |
| Insurance status | |||
| Private insurance | Reference | Reference | Reference |
| Government insurance | −6.5 (−8.0 to −4.9) | −8.6 (−10.3 to −7.0) | −4.9 (−6.1 to −3.8) |
| Other/no insurance | −3.2 (−4.7 to −1.7) | −3.4 (−5.0 to −1.8) | −2.7 (−3.8 to −1.6) |
| CFTR functional class | |||
| Minimal | Reference | Reference | Reference |
| Residual | 9.9 (8.1 to 11.7) | 10.4 (8.5 to 12.2) | 5.7 (4.1 to 7.4) |
| Other/unknown | 4.3 (3.0 to 5.7) | 3.4 (2.0 to 4.8) | 1.1 (−0.1 to 2.3) |
| Age × post-NBS group Interaction | −0.4 (−0.4 to −0.3) | −0.5 (−0.5 to −0.4) | 0.5 (0.4 to 0.7) |
Abbreviations: FEV1, forced expiratory volume in the first second of expiration; NBS, newborn screening.
Association of NBS With Lung Function
Mean annualized FEV1 percent predicted was similar at age 6 years in the pre-NBS and post-NBS cohorts, though a difference appeared with age (Figure 2 and Table 2) as evidenced by a significant interaction term (interaction term: age × post-NBS group, 0.5; 95% CI, 0.4-0.7). In longitudinal modeling, the main association of NBS with FEV1 percent predicted was not significant, but there was a significant positive interaction, indicating that although the population-average FEV1 was similar between the pre-NBS and post-NBS cohorts at age 6 years, the difference increased with age. At age 6 years, children born post-NBS had a nonsignificant estimated mean predicted FEV1 0.8% (95% CI, −1.1% to 2.9%) higher than those born pre-NBS; at age 10 years, the difference was 2.6% (95% CI, 0.7%-4.6%) higher. Results were similar for FVC and FEV1/FVC % predicted (eFigure 3, eTable 1 in the Supplement).
Association of NBS With Initial and Chronic P aeruginosa Infection
NBS was associated with older age at chronic P aeruginosa infection (hazard ratio [HR], 0.69; 95% CI, 0.54-0.89) but not initial P aeruginosa infection (HR, 0.88; 95% CI, 0.77-1.01) (Table 3). Children born after NBS were more likely to have their first recorded culture before age 1 year (90.0% [4172 of 4634] vs 62.5% [2765 of 4421]) and less likely to have their first-recorded culture be positive for P aeruginosa (8.3% [383 of 4634] vs 20.2% [891 of 4421]). We performed analyses including and excluding participants with prevalent P aeruginosa infection (ie, first-recorded culture of P aeruginosa); HRs were very similar (Table 3). Results of the sensitivity analyses to address imbalances in CFTR functional class and modulator use in the pre-NBS vs post-NBS cohorts are available in the eResults, eTables 2 and 3, and eFigures 4 and 5 in the Supplement.
Table 3. Results of Models to Estimate Hazard of Incident and Chronic Pseudomonas aeruginosa.
| Variable | HR (95% CI) | |||
|---|---|---|---|---|
| Incident Pseudomonas aeruginosa | Chronic Pseudomonas aeruginosaa | |||
| Include prevalent infectionb | Exclude prevalent infection | Include prevalent infection | Exclude prevalent infection | |
| Sample size, No. | ||||
| Pre NBS | 4421 | 3530 | 3474 | 2583 |
| Post NBS | 4634 | 4251 | 2882 | 2439 |
| Parameter | ||||
| Newborn screening (post vs pre) | 0.88 (0.77-1.01) | 0.91 (0.78-1.05) | 0.69 (0.54-0.89) | 0.65 (0.48-0.87) |
| Age | 0.83 (0.81-0.85) | 0.87 (0.86-0.89) | 0.95 (0.93-0.97) | 0.97 (0.94-0.99) |
| Birth cohort | ||||
| 2012-2017 vs 2000-2003 | 0.86 (0.74-1.01) | 0.88 (0.74-1.05) | 1.22 (0.89-1.66) | 1.26 (0.88-1.79) |
| 2008-2011 vs 2000-2003 | 0.88 (0.77-1.04) | 0.98 (0.84-1.15) | 1.02 (0.78-1.33) | 1.06 (0.78-1.44) |
| 2004-2007 vs 2000-2003 | 0.95 (0.88-1.01) | 1.02 (0.95-1.10) | 0.89 (0.78-1.01) | 0.91 (0.79-1.05) |
| Sex (female vs male) | 1.06 (1.01-1.11) | 1.07 (1.01-1.13) | 1.08 (1.04-1.27) | 1.05 (0.94-1.18) |
| Insurance | ||||
| Public vs private | 1.17 (1.11-1.24) | 1.14 (1.08-1.21) | 1.14 (1.04-1.27) | 1.14 (1.01-1.29) |
| Other vs private | 0.87 (0.77-1.01) | 1.03 (0.88-1.19) | 1.67 (1.28-2.18) | 1.33 (0.94-1.89) |
| CFTR functional class | ||||
| Residual vs minimal | 0.49 (0.43-0.56) | 0.47 (0.41-0.53) | 0.78 (0.58-1.04) | 0.89 (0.64-1.22) |
| Unknown vs minimalc | 0.77 (0.71-0.83) | 0.73 (0.66-0.79) | 0.93 (0.79-1.09) | 0.92 (0.76-1.12) |
Abbreviations: HR, hazard ratio; NBS, newborn screening.
Chronic Pseudomonas aeruginosa infection defined as of at least 3 positive P aeruginosa quarters in a 12-month period.16
Prevalent P aeruginosa defined as first-recorded positive culture for P aeruginosa. HR estimated using a Weibull model to accommodate unequal time intervals.
Unknown includes participants for whom genotyping has not been performed and those for whom CFTR variants have been identified but functional class is undefined.
Discussion
On the 10th anniversary of universal NBS for CF across all 50 states in the US, we evaluated the association of NBS programs with clinical outcomes over the first 10 years of life. In the US, NBS programs are directed by each state rather than at the federal level. We were able to take advantage of the staggered introduction of NBS for CF across states between 2004 and 2009 to employ a retrospective, nonexperimental stepped-wedge cohort study design, which allowed us to account for secular improvements in CF outcomes over the study period. Specifically, we compared longitudinal outcomes of children in the same birth cohort born before vs after the introduction of NBS for CF in their state of birth.
We found a clinically and statistically significant difference in both height and weight percentile after introduction of NBS, although the association attenuated with age. In contrast, we did not find an association between NBS and lung function at age 6 years, although children born post-NBS did have a significantly greater increase in lung function between ages 6 and 10 years than those born before NBS. We also found a significantly decreased risk of chronic P aeruginosa infection associated with NBS, with risk approximately one-third less among the post-NBS cohort.
Comparison With Prior Studies
Improved nutritional outcomes with NBS have been a remarkably consistent association across multiple studies, as prompt diagnosis allows earlier introduction of pancreatic enzyme–replacement therapy and close monitoring of growth and caloric intake. The Wisconsin CF Neonatal Screening Project5 enrolled infants born between 1985 and 1994, all of whom underwent screening for CF. Infants randomly assigned to the screened group were informed of a positive result in the first month of life and those in the control group when they presented with symptoms of CF or at age 4 years. The trial found significantly greater weight and height among children with CF in the NBS group that, although diminished in magnitude, persisted to age 18 years.19,20 Improvements in nutritional outcomes, particularly in early life, have also been seen in multiple observational studies of NBS.21,22,23,24,25,26,27
The association of NBS with pulmonary outcomes has been less clear. In the Wisconsin CF Neonatal Screening Project, although screened patients had better chest radiograph scores than controls at diagnosis, at ages 8 to 18 years, their scores were worse than those of controls.28,29 A recent long-term follow-up of the trial cohort revealed that screened patients actually had a greater rate of decline in lung function (ie, FEV1) than control patients up to age 26 years.30 Patients in the Wisconsin CF Neonatal Screening Project entered the health care setting at a time before strict infection-control policies, therefore, the screened patients’ earlier diagnosis actually led to earlier acquisition of P aeruginosa.31,32,33 When stratified by age at P aeruginosa acquisition, the greater rate of lung function decline among screened patients was confined to those acquiring P aeruginosa at 2 years or younger, suggesting that earlier P aeruginosa acquisition among the screened group was a primary driver of worse long-term pulmonary outcomes in that cohort.
Based in part on lessons learned from the Wisconsin CF Neonatal Project, strict infection-control policies are now in place at all CF centers,34 resulting in decreased patient-to-patient pathogen transmission.35 Since the implementation of these guidelines, there have been no further reports of earlier P aeruginosa acquisition among infants detected by NBS. In fact, most recent reports, like ours, have shown delayed P aeruginosa acquisition among screened patients. Among children born between 2008 and 2013 who were included in the Canadian CF Registry, Mak and colleagues25 found delayed age at acquisition of both P aeruginosa and Staphylococcus aureus in screened patients; they did not evaluate chronic P aeruginosa nor lung function. A recent longitudinal study by Schlüter et al26 of children with CF born between 2000 and 2015 included in the UK CF Registry found delayed time to chronic P aeruginosa infection in the UK; they did not evaluate time to incident P aeruginosa infection. We found later age at acquisition of chronic but not incident P aeruginosa infection. A potential explanation for this finding is that initial acquisition of P aeruginosa is a stochastic event, whereas risk of chronic P aeruginosa infection can be mitigated by treatment (eg, P aeruginosa–eradication regimens). We also performed analyses both including and excluding prevalent P aeruginosa (ie, excluding patients whose first-recorded culture was P aeruginosa positive) with similar results.
Even in the current era of strict infection control, the association of NBS with lung function has been mixed. For example, Schlüter et al26 found slightly greater FEV1 among screened patients but no difference in the rate of decline between screened and symptomatically diagnosed patients up to age 15 years. A likely explanation for the slight difference compared with our findings of no difference at age 6 years but more rapid growth in FEV1 in the post-NBS cohort between ages 6 and 10 years is that Schlüter et al26 modeled FEV1 trajectory as a straight line (intercept and slope) using annualized data, whereas we found that inclusion of a quadratic term provided a better fit and used encounter-based data. In addition, Schlüter et al26 classified patients based on individual mode of diagnosis. In contrast, we classified patients based on whether they were born before or after the start of NBS in their state of birth. It is also notable that the precision of the prediction interval in our models (Figure 2) was much narrower in the post-NBS group than in the pre-NBS group despite the much smaller sample size of the post-NBS group, suggesting that NBS may play a role in preventing early lung-function decline by age 10 years. Older observational studies have consistently demonstrated an association between nutritional status before age 3 years and lung function at age 6 years.36,37,38 Given that we observed an association between NBS and both weight and height, a potential explanation for the lack of an association between NBS and FEV1 is that FEV1 is no longer a sensitive measure of lung disease in children with CF as outcomes have improved. More sensitive measures not routinely performed in clinical care (or recorded in the CF registry), such as multiple breath washout or chest computed tomography might be better end points with which to quantify lung health in this population and potentially detect a difference between the pre-NBS and post-NBS cohorts.39,40
Clinical Implications
Significant advances in CF care have improved outcomes for young children over the past 2 decades, including more aggressive and standardized nutritional support, increased uptake of chronic inhaled mucolytics, and P aeruginosa–eradication protocols becoming standard of care. Earlier diagnosis through NBS has enabled earlier access to these interventions. More recently, CF transmembrane conductance–regulator modulators, oral agents that partially correct the malfunctioning epithelial ion channel made by the CFTR gene, have become available to an ever-increasing proportion of people with CF. The highly effective modulator, elexacaftor/tezacaftor/ivacaftor (E/T/I), causes dramatic and sustained improvements in nutritional status, lung function, and quality of life.41,42 Although highly effective modulators initiated later in life cannot reverse bronchiectasis or CF-related damage to other organs, initiation of E/T/I and future modulators before irreversible organ damage could be truly disease modifying, realizing the full potential of NBS.
Implications for Other Conditions
The underlying rationale for NBS is to enable treatment before irreversible organ damage. In this era of precision medicine, infants now have access to bone marrow transplants for severe-combined immunodeficiency,43 gene therapy for spinal muscular atrophy,44 and experimental gene therapy for many other inherited disorders. As these early interventions become a reality, more conditions will be added to state NBS panels; precision medicine and NBS are inextricably linked. As randomized clinical trials of NBS are rarely conducted, we generally rely on observational studies to evaluate the effectiveness of these programs. We hope that the study design used in our evaluation of NBS for CF, which used staggered implementation of screening at the state level to mimic an observational stepped-wedge design, may be useful to investigators evaluating the association of screening for other conditions with clinical outcomes among US infants.
Strengths and Limitations
Our study had several strengths. Many prior observational studies were limited by small sample size, cross-sectional outcomes assessment, incomplete accounting for secular improvements in health outcomes and unmeasured confounders when comparing 2 different regions, one with NBS and one without. We used the US CFFPR, which is estimated to capture approximately 84% of patients with CF in the US4 (likely an even greater proportion of infants and young children) and provides encounter-based data on relevant health outcomes. Because of the large number of people with CF in the US, to our knowledge, ours is the largest study to date evaluating health outcomes associated with NBS (N = 9500, evenly divided between pre-NBS and post-NBS cohorts); the next largest study is that of Schlüter et al26 in the UK (N = approximately 3000). The staggered implementation of NBS for CF across US states between 2004 and 2009 allowed us to mimic an observational (nonexperimental) stepped-wedge design9 in which the states were the clusters and we could distinguish the association of NBS with secular improvements in outcomes during the study period by adjusting for birth cohort (steps). We chose to model the exposure at the population level (born before vs after NBS implementation) to evaluate associations between implementation of NBS programs and health outcomes, in keeping with our focus on effectiveness rather than efficacy. This approach would tend to bias results toward the null given that some infants are diagnosed early in both the pre-NBS and post-NBS cohorts due to meconium ileus or prenatal diagnosis, and some infants (1%-4%) born after NBS have false-negative screens. We modeled age as a cubic (for nutritional parameters) or quadratic (for lung function) term to provide the best fit for the longitudinal measures.
Our study also had important limitations. There may be infants with CF not included in the registry, whose outcomes could systematically differ from patients enrolled in the registry. Although the size of our overall cohort was approximately 9500, our sample size was much smaller for lung function because it only measured children older than 6 years, and children in the post-NBS cohort were born as late as 2018. In addition, our follow-up was limited to age 10 years. Longer follow-up may provide further insights into the association between NBS and FEV1 (especially as associations may increase with age), help determine if changes in nutritional status are sustained through adolescence, and enable evaluation of survival as an outcome. There is wide variability45 between states and, over time, in screening algorithms. Therefore, timeliness of diagnosis and false-negative rate that can result in delayed diagnosis and an attenuation of the potential effect of NBS. Finally, we were limited to outcomes captured in the registry; therefore, we were not able to evaluate the association of NBS for CF with bronchiectasis or with sensitive lung-function measures, such as the lung-clearance index.
Conclusions
In this cohort study, NBS for CF in the US was associated with improved nutritional status up to age 10 years, a more rapid increase in lung function, and delayed chronic P aeruginosa infection. In the future, as highly effective modulator therapies become available for infants with CF, NBS will allow for presymptomatic initiation of these disease-modifying therapies before irreversible organ damage.
eMethods
eResults
eTable 1. Lung Function Models: Parameter Estimates From Linear Mixed-Effects Model
eTable 2. Sensitivity Analysis of Main Results, Restricted to Participants With Minimal Function CFTR Genotypes
eTable 3. Sensitivity Analysis of Main Results: Restrict to Participants Born 2005-2008 Homozygous for F508del, With Observations Censored at Age of First-Reported Use of Lumacaftor-Ivacaftor
eFigure 1. Total Observations Provided by Age and NBS Status, by Outcome
eFigure 2. Cumulative Proportion of Children Diagnosed by Age Among Children With at Least 10 Years of Follow-up
eFigure 3. FVC and FEV1/FVC Ratio Model Results
eFigure 4. Sensitivity Analysis: Illustration of Model Predictions for Analysis Restricted to Participants With Minimal Function CFTR Genotypes
eFigure 5. Sensitivity Analysis: Illustration of Model Predictions for Analysis Restricted to F508del Homozygous Participants Born Between 2005-2008 Censored at Age of First-Reported Use of Lumacaftor-Ivacaftor
References
- 1.American College of Medical Genetics Newborn Screening Expert Group . Newborn screening: toward a uniform screening panel and system—executive summary. Pediatrics. 2006;117(5 pt 2):S296-S307. doi: 10.1542/peds.2005-2633I [DOI] [PubMed] [Google Scholar]
- 2.National Institutes of Health . How many newborns are screened in the US. Accessed May 2, 2022. https://www.nichd.nih.gov/health/topics/newborn/conditioninfo/infants-screened
- 3.Centers for Disease Control and Prevention (CDC) . Ten great public health achievements—US, 2001-2010. MMWR Morb Mortal Wkly Rep. 2011;60(19):619-623. [PubMed] [Google Scholar]
- 4.Stephenson AL, Bell SC. The Cystic Fibrosis Foundation patient registry—design and methods of a national observational disease registry. Ann Am Thorac Soc. 2016;13(7):1014-1015. doi: 10.1513/AnnalsATS.201604-250ED [DOI] [PubMed] [Google Scholar]
- 5.Farrell PM, Kosorok MR, Rock MJ, et al. ; Wisconsin Cystic Fibrosis Neonatal Screening Study Group . Early diagnosis of cystic fibrosis through neonatal screening prevents severe malnutrition and improves long-term growth. Pediatrics. 2001;107(1):1-13. doi: 10.1542/peds.107.1.1 [DOI] [PubMed] [Google Scholar]
- 6.Cystic Fibrosis Foundation . Patient Registry 2020 Annual Data Report. Accessed October 5, 2020. https://www.cff.org/sites/default/files/2021-11/Patient-Registry-Annual-Data-Report.pdf
- 7.VanDevanter DR, Pasta DJ, Konstan MW. Improvements in lung function and height among cohorts of 6-year-olds with cystic fibrosis from 1994 to 2012. J Pediatr. 2014;165(6):1091-1097.e2. doi: 10.1016/j.jpeds.2014.06.061 [DOI] [PMC free article] [PubMed] [Google Scholar]
- 8.Farrell PM, White TB, Ren CL, et al. Diagnosis of cystic ribrosis: consensus guidelines from the Cystic Fibrosis Foundation. J Pediatr. 2017;181S:S4-S15.e1. doi: 10.1016/j.jpeds.2016.09.064 [DOI] [PubMed] [Google Scholar]
- 9.Datar A, Shier V, Braboy A, et al. Assessing impacts of redeveloping public housing communities on obesity in low-income minority residents: rationale, study design, and baseline data from the Watts Neighborhood Health Study. Contemp Clin Trials Commun. 2021;25:100879. doi: 10.1016/j.conctc.2021.100879 [DOI] [PMC free article] [PubMed] [Google Scholar]
- 10.Kuczmarski RJ, Ogden CL, Guo SS, et al. 2000 CDC growth charts for the US: methods and development. Vital Health Stat 11. 2002;(246):1-190. [PubMed] [Google Scholar]
- 11.Group WHOMGRS; WHO Multicentre Growth Reference Study Group . WHO child growth standards based on length/height, weight and age. Acta Paediatr Suppl. 2006;450:76-85. doi: 10.1111/j.1651-2227.2006.tb02378.x [DOI] [PubMed] [Google Scholar]
- 12.Quanjer PH, Stanojevic S, Cole TJ, et al. ; ERS Global Lung Function Initiative . Multi-ethnic reference values for spirometry for the 3- to 95-y age range: the global lung function 2012 equations. Eur Respir J. 2012;40(6):1324-1343. doi: 10.1183/09031936.00080312 [DOI] [PMC free article] [PubMed] [Google Scholar]
- 13.Hussey MA, Hughes JP. Design and analysis of stepped wedge cluster randomized trials. Contemp Clin Trials. 2007;28(2):182-191. doi: 10.1016/j.cct.2006.05.007 [DOI] [PubMed] [Google Scholar]
- 14.Green DM, McDougal KE, Blackman SM, et al. Mutations that permit residual CFTR function delay acquisition of multiple respiratory pathogens in CF patients. Respir Res. 2010;11:140. doi: 10.1186/1465-9921-11-140 [DOI] [PMC free article] [PubMed] [Google Scholar]
- 15.Schechter MS, Shelton BJ, Margolis PA, Fitzsimmons SC. The association of socioeconomic status with outcomes in cystic fibrosis patients in the US. Am J Respir Crit Care Med. 2001;163(6):1331-1337. doi: 10.1164/ajrccm.163.6.9912100 [DOI] [PubMed] [Google Scholar]
- 16.Heltshe SL, Khan U, Beckett V, et al. Longitudinal development of initial, chronic, and mucoid Pseudomonas aeruginosa infection in young children with cystic fibrosis. J Cyst Fibros. 2018;17(3):341-347. doi: 10.1016/j.jcf.2017.10.008 [DOI] [PMC free article] [PubMed] [Google Scholar]
- 17.Allison PD. Survival Analysis Using SAS: A Practical Guide. 2nd ed. SAS Institute; 2010:336. [Google Scholar]
- 18.Bellamy SL, Li Y, Ryan LM, Lipsitz S, Canner MJ, Wright R. Analysis of clustered and interval censored data from a community-based study in asthma. Stat Med. 2004;23(23):3607-3621. doi: 10.1002/sim.1918 [DOI] [PubMed] [Google Scholar]
- 19.Farrell PM, Lai HJ, Li Z, et al. Evidence on improved outcomes with early diagnosis of cystic fibrosis through neonatal screening: enough is enough! J Pediatr. 2005;147(3)(suppl):S30-S36. doi: 10.1016/j.jpeds.2005.08.012 [DOI] [PubMed] [Google Scholar]
- 20.Zhang Z, Lindstrom MJ, Farrell PM, Lai HJ; Wisconsin Cystic Fibrosis Neonatal Screening Group . Pubertal height growth and adult height in cystic fibrosis after newborn screening. Pediatrics. 2016;137(5):e20152907. doi: 10.1542/peds.2015-2907 [DOI] [PMC free article] [PubMed] [Google Scholar]
- 21.Grosse SD, Rosenfeld M, Devine OJ, Lai HJ, Farrell PM. Potential impact of newborn screening for cystic fibrosis on child survival: a systematic review and analysis. J Pediatr. 2006;149(3):362-366. doi: 10.1016/j.jpeds.2006.04.059 [DOI] [PubMed] [Google Scholar]
- 22.Castellani C. Evidence for newborn screening for cystic fibrosis. Paediatr Respir Rev. 2003;4(4):278-284. doi: 10.1016/S1526-0542(03)00085-X [DOI] [PubMed] [Google Scholar]
- 23.Sims EJ, Clark A, McCormick J, Mehta G, Connett G, Mehta A; United Kingdom Cystic Fibrosis Database Steering Committee . Cystic fibrosis diagnosed after 2 months of age leads to worse outcomes and requires more therapy. Pediatrics. 2007;119(1):19-28. doi: 10.1542/peds.2006-1498 [DOI] [PubMed] [Google Scholar]
- 24.Sims EJ, McCormick J, Mehta G, Mehta A; Steering Committee of the UK Cystic Fibrosis Database . Neonatal screening for cystic fibrosis is beneficial even in the context of modern treatment. J Pediatr. 2005;147(3)(suppl):S42-S46. doi: 10.1016/j.jpeds.2005.08.002 [DOI] [PubMed] [Google Scholar]
- 25.Mak DY, Sykes J, Stephenson AL, Lands LC. The benefits of newborn screening for cystic fibrosis: the Canadian experience. J Cyst Fibros. 2016;15(3):302-308. doi: 10.1016/j.jcf.2016.04.001 [DOI] [PubMed] [Google Scholar]
- 26.Schlüter DK, Southern KW, Dryden C, Diggle P, Taylor-Robinson D. Impact of newborn screening on outcomes and social inequalities in cystic fibrosis: a UK CF registry-based study. Thorax. 2020;75(2):123-131. doi: 10.1136/thoraxjnl-2019-213179 [DOI] [PMC free article] [PubMed] [Google Scholar]
- 27.Waters DL, Wilcken B, Irwing L, et al. Clinical outcomes of newborn screening for cystic fibrosis. Arch Dis Child Fetal Neonatal Ed. 1999;80(1):F1-F7. doi: 10.1136/fn.80.1.F1 [DOI] [PMC free article] [PubMed] [Google Scholar]
- 28.Farrell PM, Li Z, Kosorok MR, et al. Bronchopulmonary disease in children with cystic fibrosis after early or delayed diagnosis. Am J Respir Crit Care Med. 2003;168(9):1100-1108. doi: 10.1164/rccm.200303-434OC [DOI] [PubMed] [Google Scholar]
- 29.Tluczek A, Becker T, Laxova A, et al. Relationships among health-related quality of life, pulmonary health, and newborn screening for cystic fibrosis. Chest. 2011;140(1):170-177. doi: 10.1378/chest.10-1504 [DOI] [PMC free article] [PubMed] [Google Scholar]
- 30.Barreda CB, Farrell PM, Laxova A, et al. Newborn screening alone insufficient to improve pulmonary outcomes for cystic fibrosis. J Cyst Fibros. 2021;20(3):492-498. doi: 10.1016/j.jcf.2020.06.002 [DOI] [PMC free article] [PubMed] [Google Scholar]
- 31.Farrell PM, Shen G, Splaingard M, et al. Acquisition of Pseudomonas aeruginosa in children with cystic fibrosis. Pediatrics. 1997;100(5):E2. doi: 10.1542/peds.100.5.e2 [DOI] [PubMed] [Google Scholar]
- 32.Sanders DB, Li Z, Laxova A, et al. Risk factors for the progression of cystic fibrosis lung disease throughout childhood. Ann Am Thorac Soc. 2014;11(1):63-72. doi: 10.1513/AnnalsATS.201309-303OC [DOI] [PMC free article] [PubMed] [Google Scholar]
- 33.Kosorok MR, Jalaluddin M, Farrell PM, et al. Comprehensive analysis of risk factors for acquisition of Pseudomonas aeruginosa in young children with cystic fibrosis. Pediatr Pulmonol. 1998;26(2):81-88. doi: 10.1002/(SICI)1099-0496(199808)26:2<81::AID-PPUL2>3.0.CO;2-K [DOI] [PubMed] [Google Scholar]
- 34.Saiman L, Siegel JD, LiPuma JJ, et al. ; Cystic Fibrous Foundation; Society for Healthcare Epidemiology of America . Infection prevention and control guideline for cystic fibrosis: 2013 update. Infect Control Hosp Epidemiol. 2014;35(suppl 1):S1-S67. doi: 10.1086/676882 [DOI] [PubMed] [Google Scholar]
- 35.Salsgiver EL, Fink AK, Knapp EA, et al. Changing epidemiology of the respiratory bacteriology of patients with cystic fibrosis. Chest. 2016;149(2):390-400. doi: 10.1378/chest.15-0676 [DOI] [PMC free article] [PubMed] [Google Scholar]
- 36.Sanders DB, Fink A, Mayer-Hamblett N, et al. Early life growth trajectories in cystic fibrosis are associated with pulmonary function at age 6 years. J Pediatr. 2015;167(5):1081-8.e1. doi: 10.1016/j.jpeds.2015.07.044 [DOI] [PMC free article] [PubMed] [Google Scholar]
- 37.Sanders DB, Slaven JE, Maguiness K, Chmiel JF, Ren CL. Early life height attainment in cystic fibrosis is associated with pulmonary function at age 6 years. Ann Am Thorac Soc. 2021;18(8):1335-1342. doi: 10.1513/AnnalsATS.202008-933OC [DOI] [PubMed] [Google Scholar]
- 38.Konstan MW, Butler SM, Wohl ME, et al. ; Investigators and Coordinators of the Epidemiologic Study of Cystic Fibrosis . Growth and nutritional indexes in early life predict pulmonary function in cystic fibrosis. J Pediatr. 2003;142(6):624-630. doi: 10.1067/mpd.2003.152 [DOI] [PubMed] [Google Scholar]
- 39.Stanojevic S, Davis SD, Retsch-Bogart G, et al. Progression of lung disease in preschool patients with cystic fibrosis. Am J Respir Crit Care Med. 2017;195(9):1216-1225. doi: 10.1164/rccm.201610-2158OC [DOI] [PMC free article] [PubMed] [Google Scholar]
- 40.Turkovic L, Caudri D, Rosenow T, et al. ; AREST CF . Structural determinants of long-term functional outcomes in young children with cystic fibrosis. Eur Respir J. 2020;55(5):1900748. doi: 10.1183/13993003.00748-2019 [DOI] [PubMed] [Google Scholar]
- 41.Heijerman HGM, McKone EF, Downey DG, et al. ; VX17-445-103 Trial Group . Efficacy and safety of the elexacaftor plus tezacaftor plus ivacaftor combination regimen in people with cystic fibrosis homozygous for the F508del mutation: a double-blind, randomised, phase 3 trial. Lancet. 2019;394(10212):1940-1948. doi: 10.1016/S0140-6736(19)32597-8 [DOI] [PMC free article] [PubMed] [Google Scholar]
- 42.Nichols DP, Paynter AC, Heltshe SL, et al. ; PROMISE Study group . Clinical effectiveness of elexacaftor/tezacftor/ivacaftor in people with cystic fibrosis: a clinical trial. Am J Respir Crit Care Med. 2022; 205(5):529-539. doi: 10.1164/rccm.202108-1986OC [DOI] [PMC free article] [PubMed] [Google Scholar]
- 43.Hardin O, Lokhnygina Y, Buckley RH. Long-term clinical outcomes of severe combined immunodeficiency patients given nonablative marrow transplants. J Allergy Clin Immunol Pract. 2022;10(4):1077-1083. doi: 10.1016/j.jaip.2021.11.032 [DOI] [PubMed] [Google Scholar]
- 44.Weiß C, Ziegler A, Becker LL, et al. Gene replacement therapy with onasemnogene abeparvovec in children with spinal muscular atrophy aged 24 months or younger and bodyweight up to 15 kg: an observational cohort study. Lancet Child Adolesc Health. 2022;6(1):17-27. doi: 10.1016/S2352-4642(21)00287-X [DOI] [PubMed] [Google Scholar]
- 45.Martiniano SL, Elbert AA, Farrell PM, et al. Outcomes of infants born during the first 9 years of CF newborn screening in the US: a retrospective Cystic Fibrosis Foundation Patient Registry cohort study. Pediatr Pulmonol. 2021;56(12):3758-3767. doi: 10.1002/ppul.25658 [DOI] [PubMed] [Google Scholar]
Associated Data
This section collects any data citations, data availability statements, or supplementary materials included in this article.
Supplementary Materials
eMethods
eResults
eTable 1. Lung Function Models: Parameter Estimates From Linear Mixed-Effects Model
eTable 2. Sensitivity Analysis of Main Results, Restricted to Participants With Minimal Function CFTR Genotypes
eTable 3. Sensitivity Analysis of Main Results: Restrict to Participants Born 2005-2008 Homozygous for F508del, With Observations Censored at Age of First-Reported Use of Lumacaftor-Ivacaftor
eFigure 1. Total Observations Provided by Age and NBS Status, by Outcome
eFigure 2. Cumulative Proportion of Children Diagnosed by Age Among Children With at Least 10 Years of Follow-up
eFigure 3. FVC and FEV1/FVC Ratio Model Results
eFigure 4. Sensitivity Analysis: Illustration of Model Predictions for Analysis Restricted to Participants With Minimal Function CFTR Genotypes
eFigure 5. Sensitivity Analysis: Illustration of Model Predictions for Analysis Restricted to F508del Homozygous Participants Born Between 2005-2008 Censored at Age of First-Reported Use of Lumacaftor-Ivacaftor
