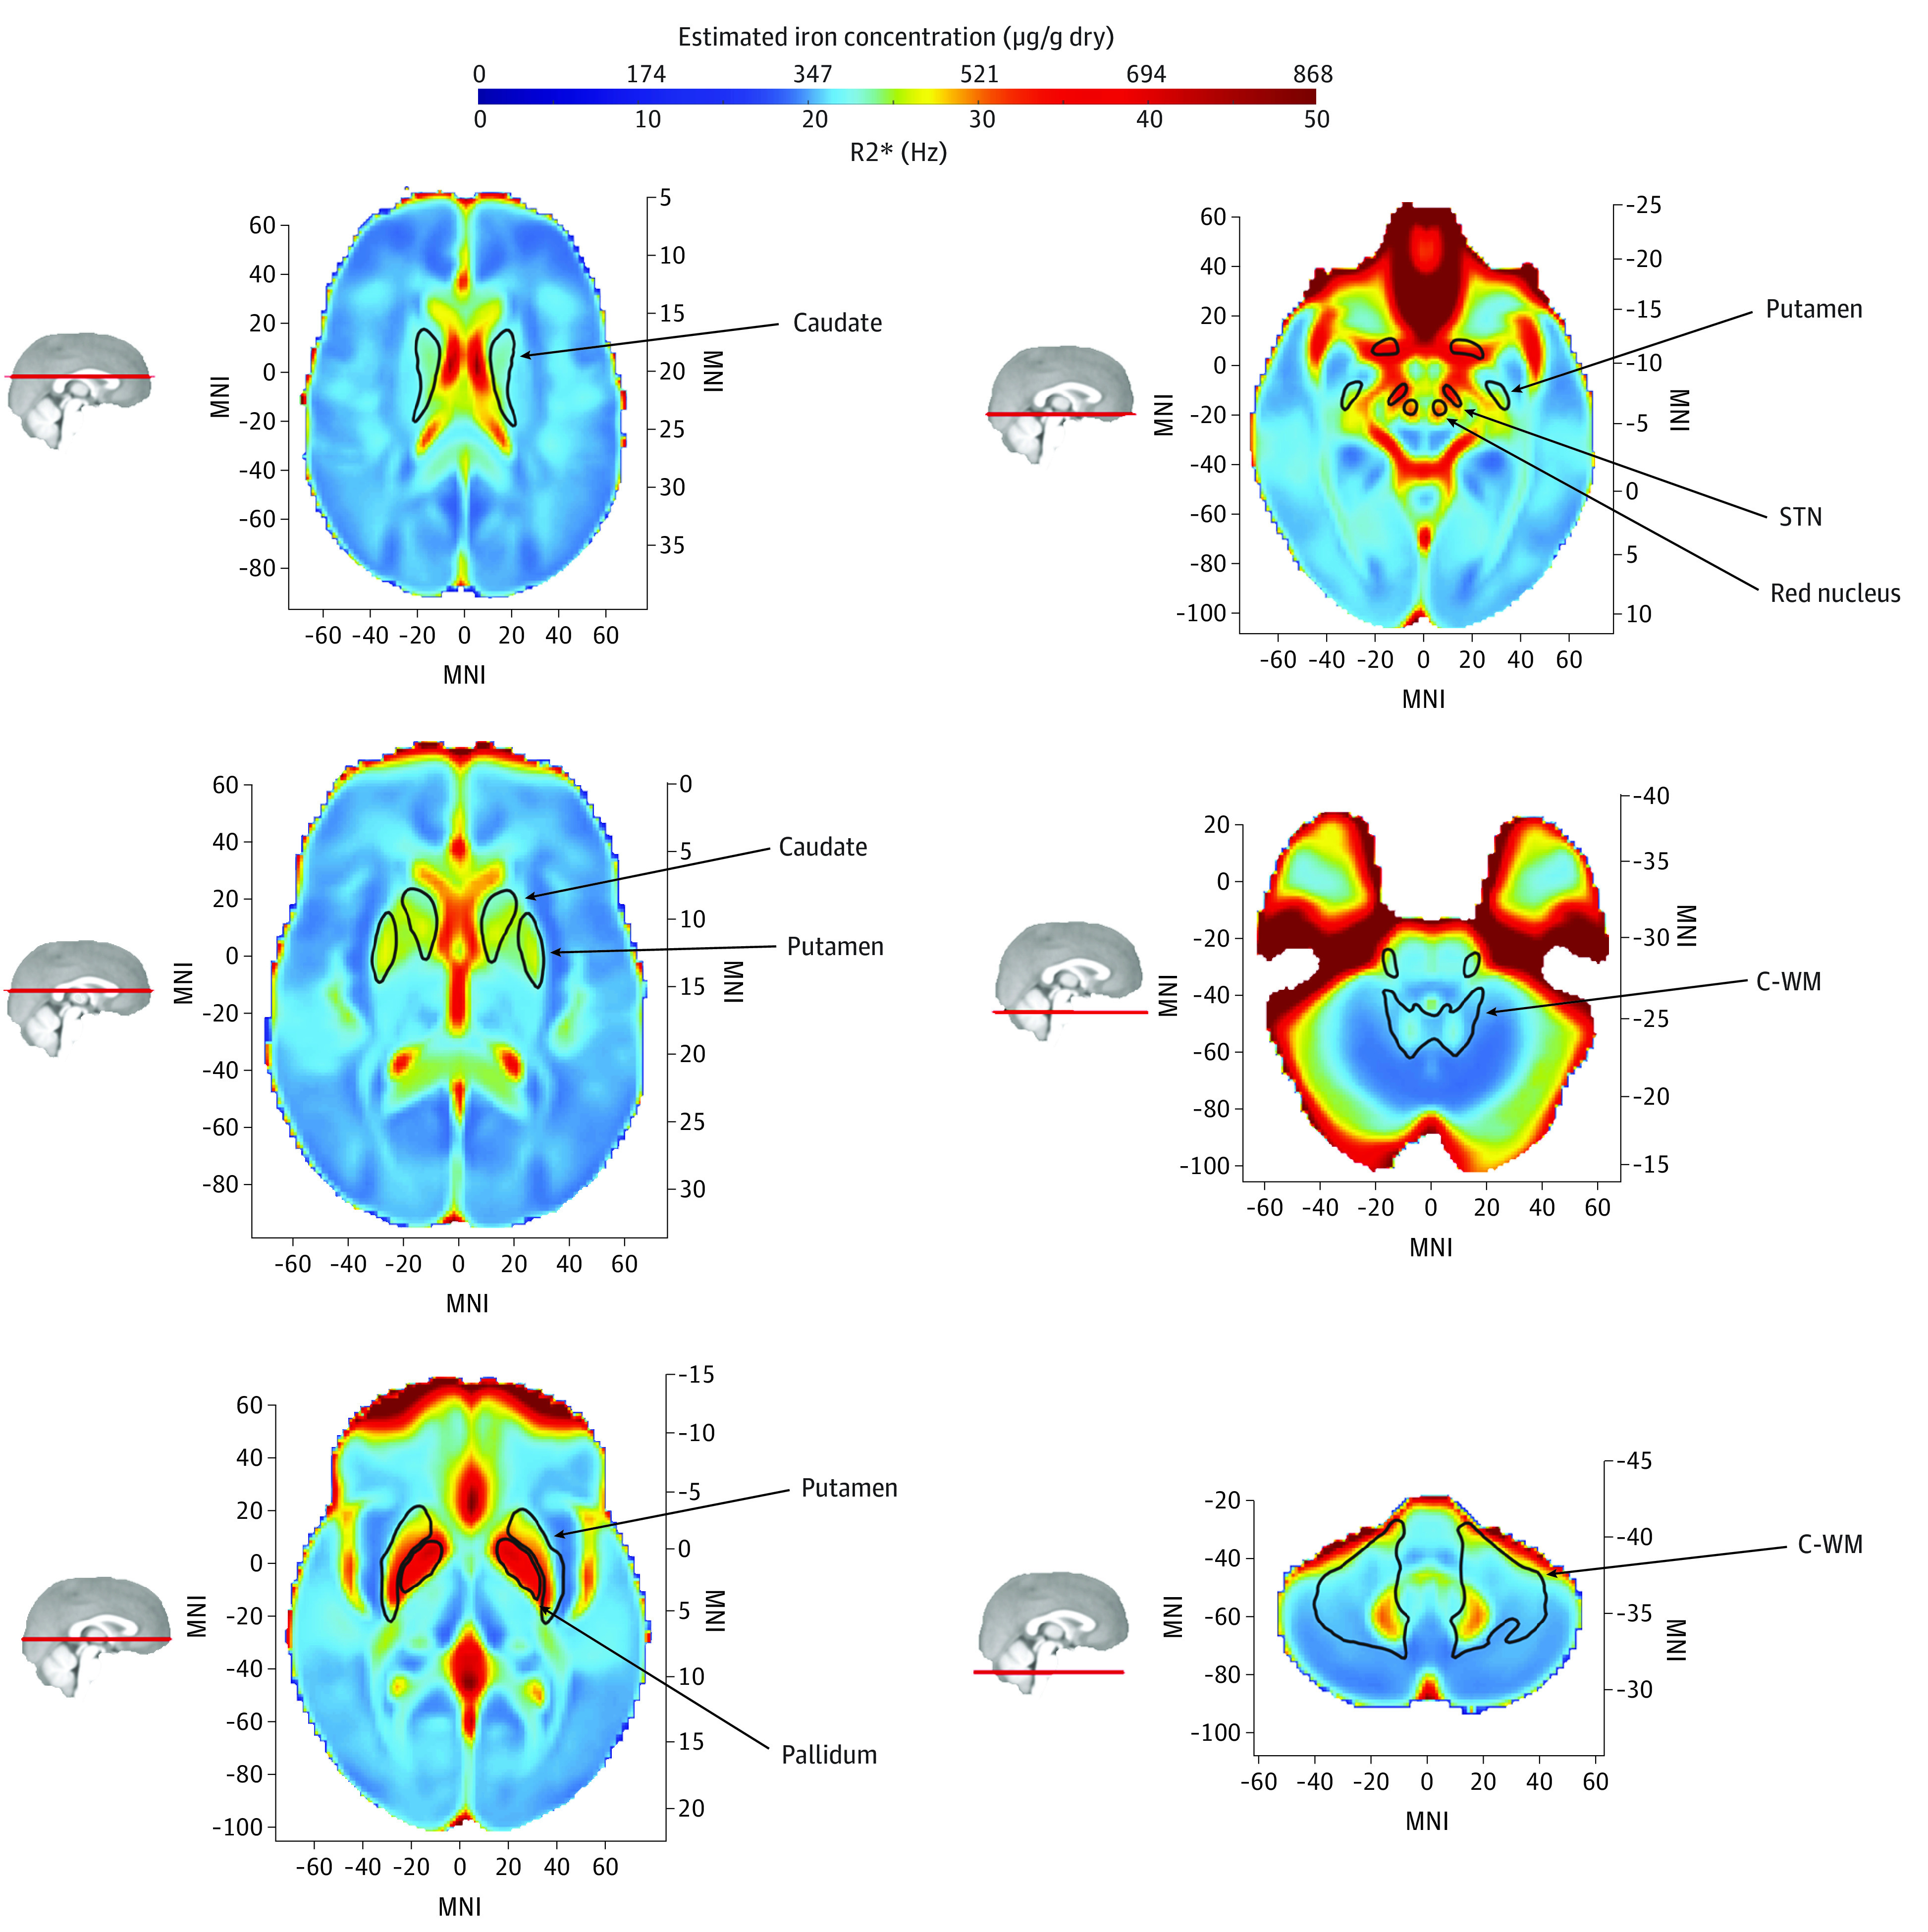
Figure 1. Mean R2* Values and Estimated Iron Concentration Across the Brain for Control Individuals.

Higher mean R2* values are observed in the pallidum, subthalamic nucleus (STN), and red nucleus. As R2* is directly proportional to iron concentration, we estimated iron concentration from R2* values. Saturated signal in anterior regions is due to loss of T2* signal related to the proximity of sphenoid sinuses and nasal cavity.30 C-WM indicates cerebral white matter; MNI, Montreal Neurological Institute coordinate.
