
Figure 2. Voxelwise Associations of T2-Weighted Intensities With p.C282Y Homozygosity Status.
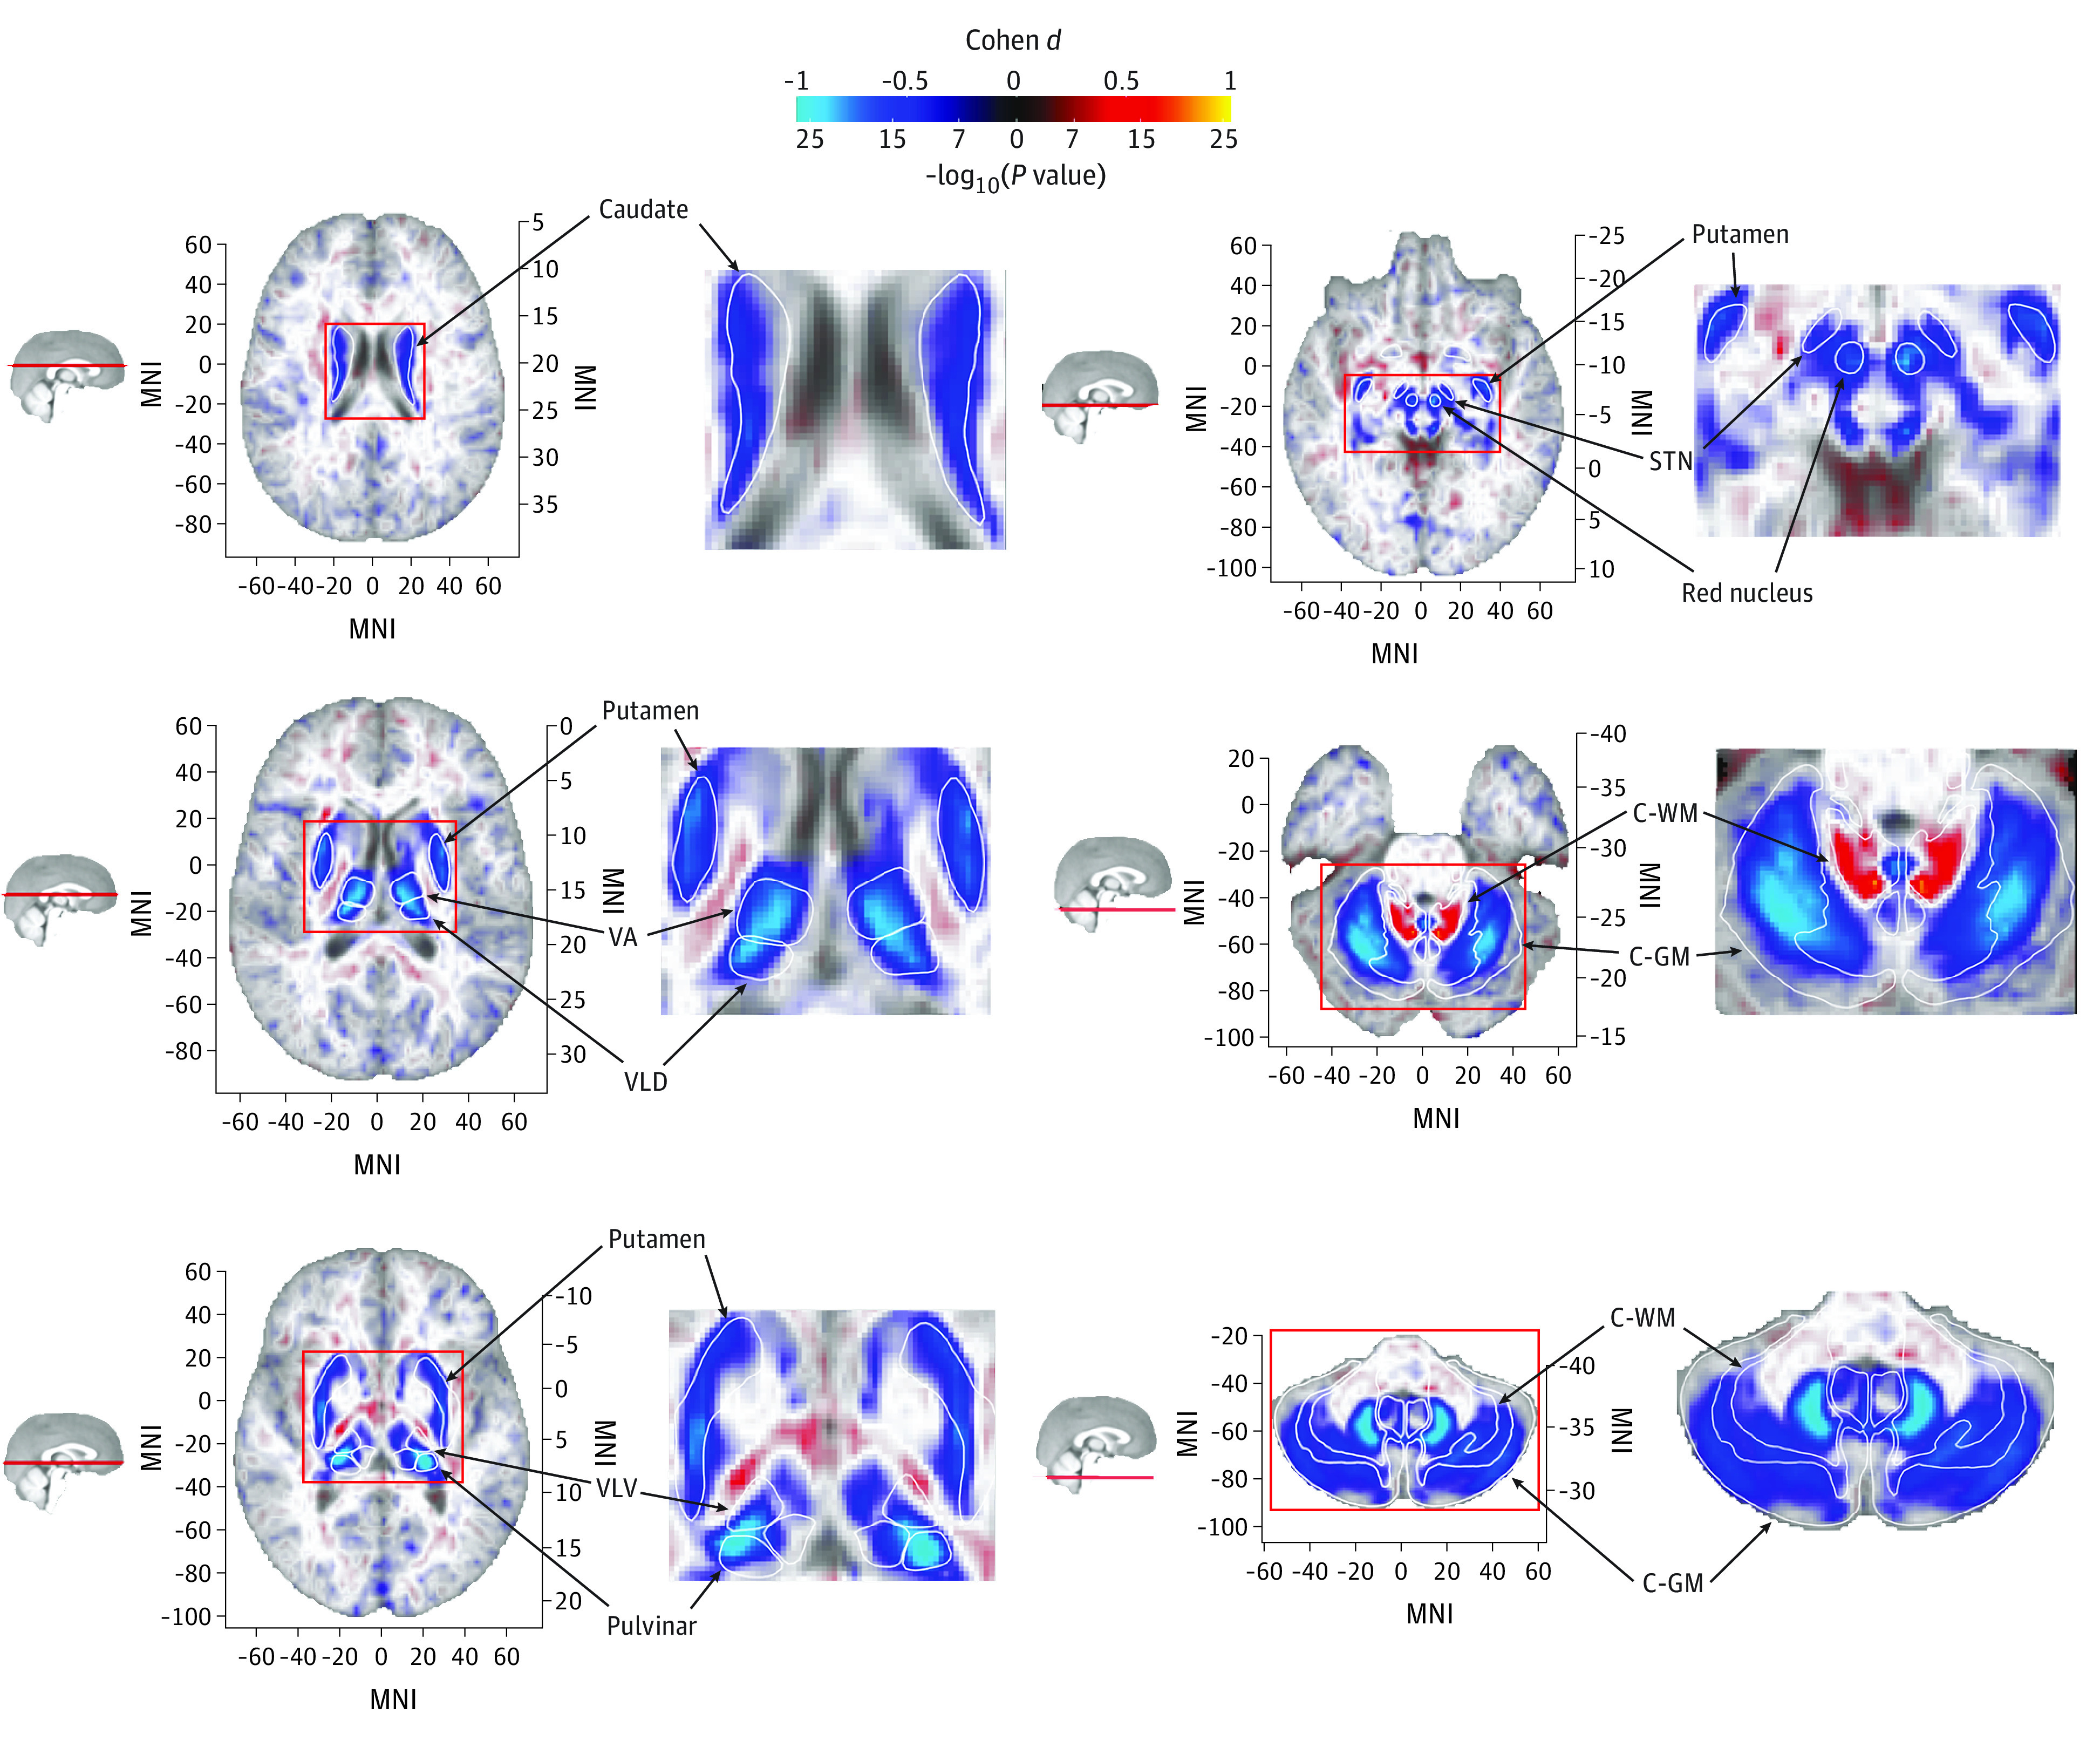
Blue regions represent lower T2-weighted intensities for p.C282Y homozygotes. Lower T2-weighted intensities are observed for p.C282Y homozygotes in the caudate nucleus, putamen, ventral anterior (VA) and ventral-lateral dorsal (VLD) nuclei of the thalamus, ventral-lateral ventral (VLV) and pulvinar nuclei of the thalamus, red nucleus, subthalamic nucleus (STN), and the cerebellum, particularly the dentate nucleus. Higher T2-weighted intensities are observed in the superior cerebellar peduncle (primary output pathway connecting the cerebellum to the thalamus and red nucleus). Large-effect voxels (Cohen d >0.5) are shown with full opacity; smaller-effect voxels are shown with linearly variable transparency such that voxels around Cohen d = 0 are almost completely transparent against the template. C-GM indicates cerebral gray matter; C-WM, cerebral white matter; MNI, Montreal Neurological Institute coordinate.