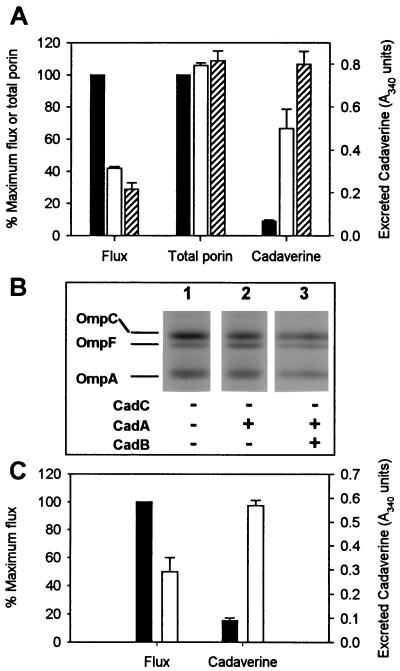
FIG. 2.
(A) Outer membrane permeability, total porin expression, and excreted cadaverine in strains HS200/pBR322 (black), HS200/pCADA/pBR322 (white), and HS200/pCADA/pCADB (hatched). The left ordinate represents the ratio of the flux rate and total porin expression in the presence of CadA or CadBA to that in the absence of CadA and CadB. Bars for flux and excreted cadaverine data represent the averages of four experiments (triplicate measurements per experiment), and the error bars indicate SEM. Bars for total porin expression represent the averages of three experiments (error bars indicate SD), one of which is shown in panel B. The rate of permeation in the control strain HS200/pBR322 was 5.2 10−5 cm/s. (B) Representative SDS-urea-PAGE of outer membrane proteins obtained from HS200/pBR322 (lane 1), HS200/pCADA/pBR322 (lane 2), and HS200/pCADA/pCADB (lane 3). The minus sign in the CadC row indicates that CadC was not activated. (C) Outer membrane permeability and excreted cadaverine in HS200/R471a (black) and HS200/R471a/pCADA (white). The left ordinate represents the ratio of the flux rate in the presence of CadA to that in the absence of CadA. Bars represent the averages of three experiments (triplicate measurements per experiment), and the error bars indicate SEM.

