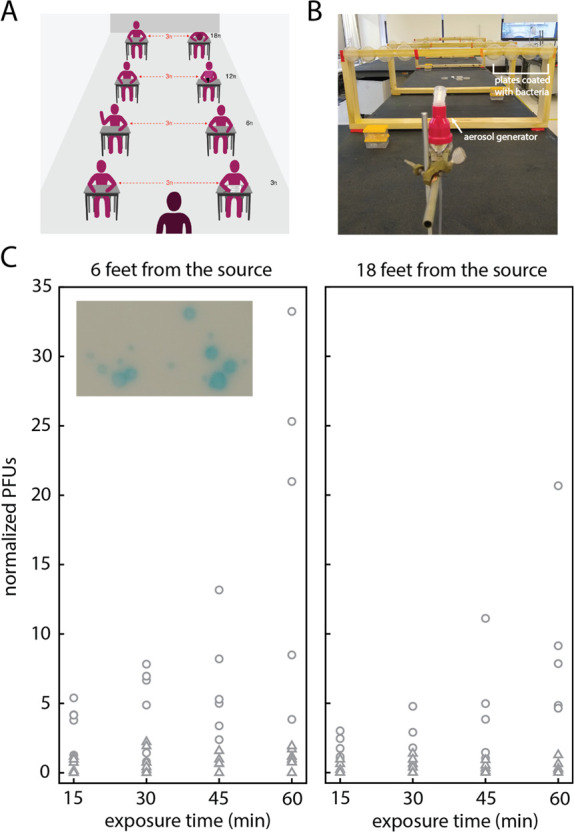
Figure 1.

Experiments to determine the spreading of viable aerosolized pathogens in closed spaces. (A) Graphical representation of a typical classroom setting where physical distancing is enforced. (B) Layout of the experiment. Detectors are placed at specified distances away from a nebulizer (located in the front of the photo). At each location we placed four detectors, which we expose for increasing durations of time: 15, 30, 45, and 60 min total. (C) Plaque counts as a function of exposure time for detectors placed 6 feet away (left panel) and 18 feet away from the source (right panel). Data points correspond to data collected in two different rooms, in a total of seven independent experiments. Circles correspond to data collected at RH below 40%; triangles correspond to data points collected at RH above 40%. Counts are normalized to 4 × 10⁷ total phage released. Data at all distances are shown in Figure S1. Inset: Blue plaque morphology shows distinct size differences.
