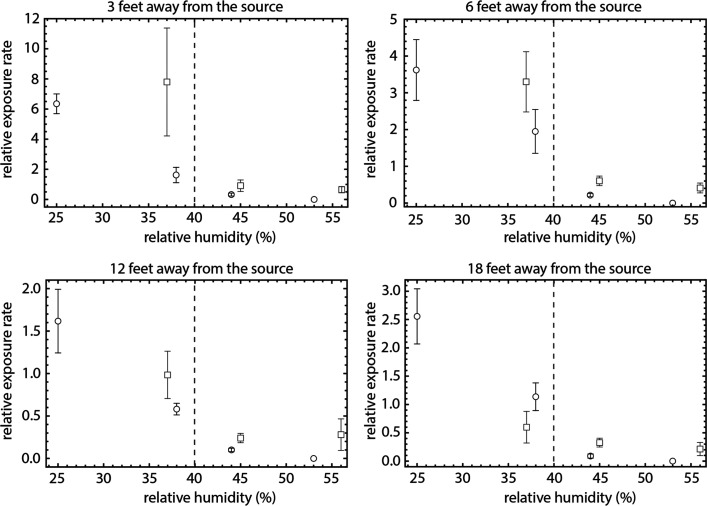
Figure 2.
Exposure to aerosolized pathogens decreases with increasing relative humidity. Panels correspond to exposure at predetermined distances away from the source. Points are averages of PFUs normalized to 4 × 10⁷ total phage released and expressed as a rate per 15 min exposure for a particular experiment, as a function of humidity, in two classrooms at The New School (rectangles, Room 300; circles, Room 400). Error bars are ± SE. RH has a margin of error ±2% according to manufacturer’s specifications. Dashed vertical line at 40% relative humidity visually separates regions of high exposure (RH below 40%) and low exposure (RH above 40%).

