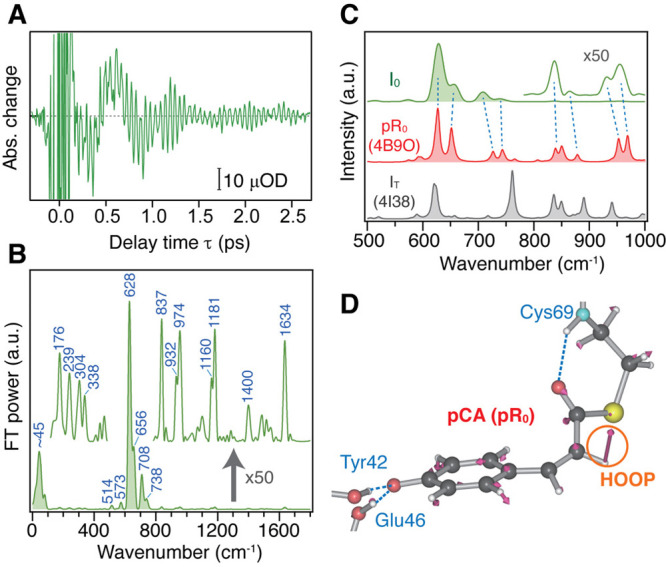
Figure 10.

(A) Oscillatory component of the TR-ISRS signal of PYP at ΔT = 60 ps, obtained after subtracting the slowly changing population component. (B) Time-resolved Raman spectrum at ΔT = 60 ps, obtained as the Fourier transform power spectrum of the oscillatory component shown in panel A. Weak bands are shown with a magnified scale (×50). (C) Calculated Raman spectra of the two model systems based on the pR0 and IT structures (PDB ID: 4B9O and 4I38) in the fingerprint region, shown with 8 cm–1 bandwidth. The experimental I0 spectrum is also shown for comparison. (D) Optimized structure of the model PYP based on pR0. Nuclear motion associated with the calculated 628 cm–1 mode is also shown with arrows. Panels A–D adapted with permission from ref (67). Copyright 2017 Nature Publishing Group.
