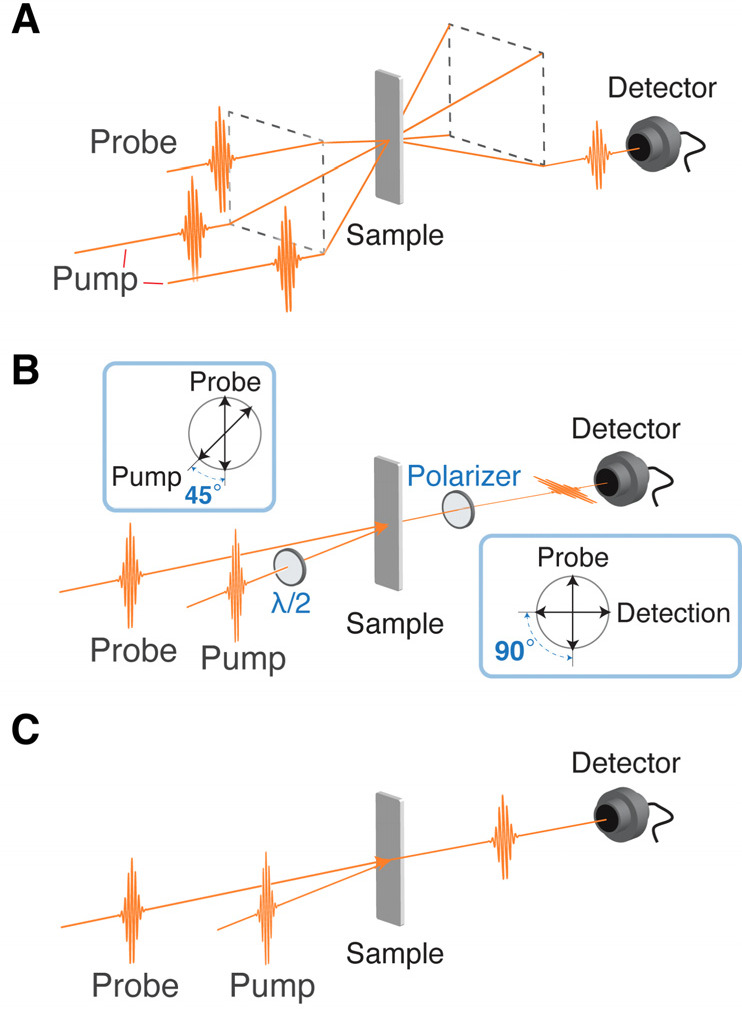
Figure 3.

Typical geometries of the time-domain Raman measurement. (A) Transient grating (TG) spectroscopy geometry, also known as BOXCARS geometry. Spatial modulation of the refractive index is induced by the two Raman pump pulses, and its temporal oscillation is monitored by detecting the diffracted Raman probe pulse emitted in the phase-matched direction. (B) Raman-induced Kerr effect spectroscopy (RIKES) geometry. The anisotropy of the refractive index (birefringence) is induced by the Raman pump pulse, and its temporal oscillation is monitored by detecting the rotation of the polarization of the Raman probe pulse. The signal can be heterodyne-detected by making the Raman probe pulse slightly elliptic with a λ/4 plate inserted to the Raman probe path. (C) Pump–probe geometry. The Raman pump pulse impulsively excites coherent Raman vibration, and resultant temporal modulation of the refractive index or electronic transition frequency is detected through the spectral shift or the absorption intensity change, respectively, of the Raman probe pulse.
