
Figure 4.
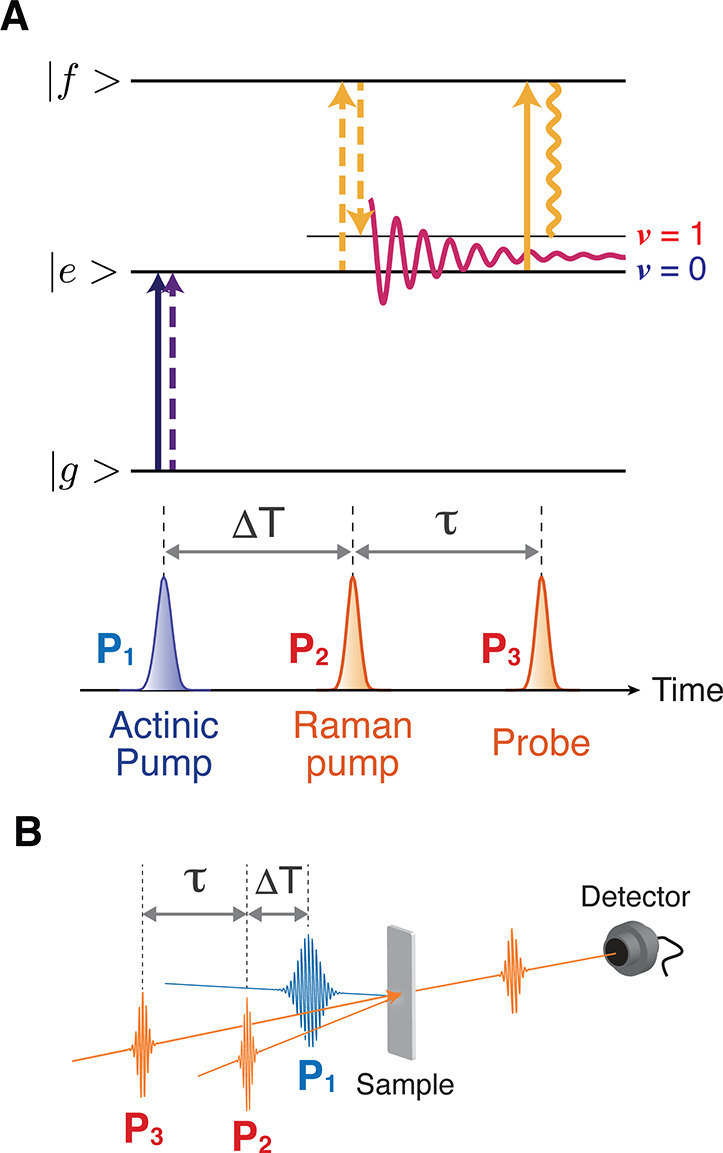
Time-resolved impulsive stimulated Raman spectroscopy (TR-ISRS). (A) Schematic diagram representing the transitions involved in TR-ISRS. The time-domain Raman measurement is performed at the arbitrary delay time ΔT, after the initiation of photoreaction by the actinic pump pulse. (B) Typical optical geometry employed in the TR-ISRS measurement. Three pulses, that is, the actinic pump, Raman pump, and Raman probe pulses, are non-collinearly introduced to the sample. The time-domain Raman signal is recorded as the oscillatory component of the Raman-pump-induced absorbance change that is monitored by the Raman probe.