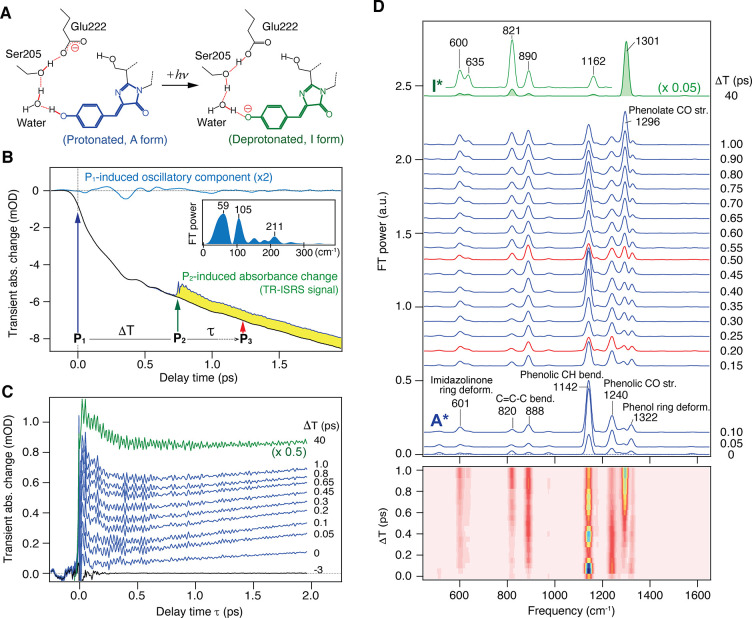
Figure 7.
(A) Schematic of the excited-state proton-transfer reaction in wild-type GFP. (B) Pump–probe (black) and TR-ISRS signals (yellow area, ΔT = 0.75 ps) of wild-type GFP (pH 8.0, in H2O). The oscillatory component of the pump–probe signal is extracted (blue), and its Fourier transform power spectrum is shown in the inset. (C) Raw TR-ISRS signals at selected ΔT delay times. (D) Time-resolved Raman spectra of wild-type GFP at various ΔT delay times (ΔT = 0–1 and 40 ps), obtained as Fourier transform power spectra of the oscillatory components of the TR-ISRS signals. The corresponding 2D representation is also shown at the bottom. Panels A–D adapted with permission from ref (62). Copyright 2016 American Chemical Society.

