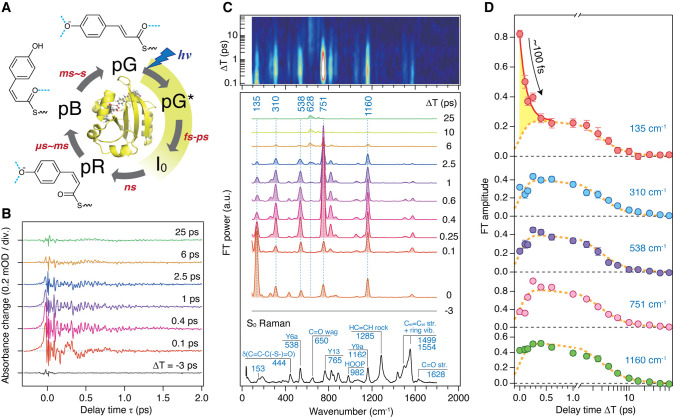
Figure 9.
(A) Crystal structure (PDB ID: 2ZOI) and photocycle of PYP. The chromophore conformation and hydrogen-bond status (blue dotted lines) in each intermediate are indicated. pG and pG* represent the ground (S0) and excited (S1) states of PYP, respectively. (B) Oscillatory component of the TR-ISRS signal of PYP obtained at various ΔT delay times. (C) Time-resolved Raman spectra at various ΔT delay times, obtained as Fourier transform power spectra of the oscillatory components of the TR-ISRS signals. Contour representation of the Fourier transform amplitude (after interpolation) is shown at the top. The steady-state pre-resonance stimulated Raman spectrum of the S0 state (pG) obtained with 490 nm Raman excitation is also shown at the bottom. (D) Temporal profiles of the Fourier transform amplitude of selected bands, highlighting the distinct temporal behavior of the 135 cm–1 band. Broken orange lines denote the best global fits to the data using the three time constants obtained from the broadband transient absorption spectroscopy, which represent the pG* population decay. Error bars represent 95% confidence intervals. Panels A–D adapted with permission from ref (67). Copyright 2017 Nature Publishing Group.

