Figure 2.
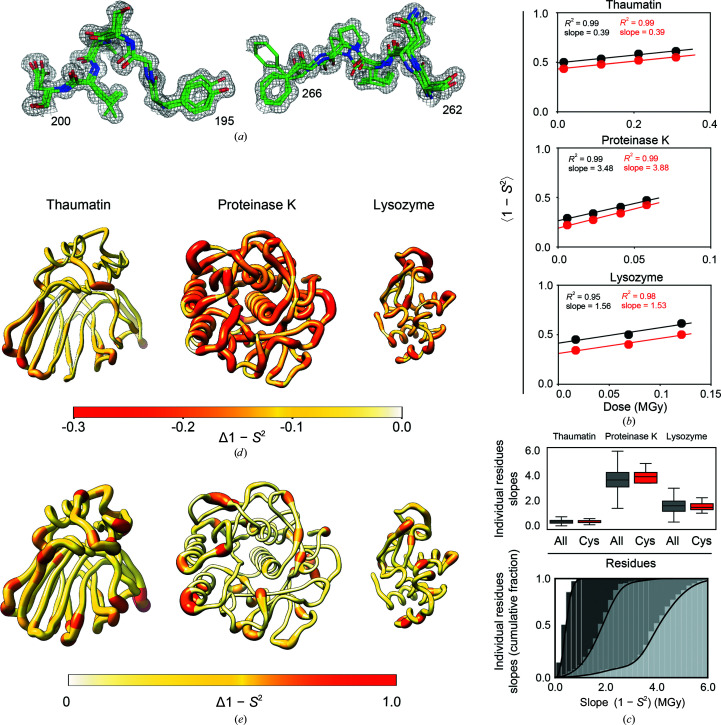
Evaluating the effects of X-ray damage on conformational heterogeneity at room temperature using multi-conformer models and disorder parameters (1 − S 2). (a) Illustration of multi-conformer models; two regions of the proteinase K 277 K multi-conformer model from the least damaged data set (PDB entry 7lpu) are shown. The multi-conformer model is shown as green sticks while the electron density is shown as a gray mesh (contour level of 1σ). (b) Average 1 − S 2 for all residues (black circles) and for disulfide bond-forming cysteine residues (red circles) as a function of the absorbed X-ray dose for each protein. (c) Top: boxplot showing the distribution of slopes obtained from a plot of the 1 − S 2 value as a function of the absorbed X-ray dose calculated for each residue in each protein. The boxes show the quartiles of the distributions, while the whiskers capture the entire distributions. Bottom: the data for all residues from the top plot now represented as a cumulative fraction. Dark to light gray: thaumatin, lysozyme, proteinase K. (d) Δ(1 − S 2) values between the least and most damaged data sets plotted on the structure of each protein. The diameter of the worm representation and the color both correlate with the magnitude of Δ(1 − S 2). (e) X-ray damage-free (extrapolated zero-dose) 1 − S 2 values plotted on the structure of each protein as in (d).

