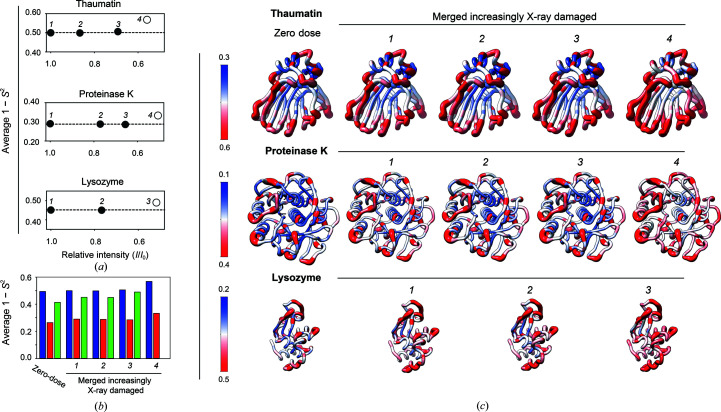
Figure 4.
Evaluating the effects of X-ray damage on conformational heterogeneity at RT (277 K) in data sets with increasingly damaged data merged together. (a) Analysis of cumulative X-ray-damaged data sets that have accumulated an increasing amount of damage to emulate typical RT data collection from single crystals. Average 1 − S 2 as a function of the relative intensity (I/I 1) of the most damaged diffraction data merged together. I/I 1 is the ratio of the total intensity of a diffraction data set from the beginning of data collection (I 1) and the intensity of a diffraction data set obtained from the same crystal orientation in later stages of data collection (I) (see Section 2). Open symbols are used when (I/I 1) is less than 0.6. (b) Bar plot of the average values for the zero-dose 1 − S 2 from sequential X-ray-damaged data sets and for 1 − S 2 from the cumulative X-ray-damaged (merged) thaumatin (blue), proteinase K (red) and lysozyme (green) data sets. (c) Comparison of zero-dose 1 − S 2 (far left) and 1 − S 2 from the least to most cumulative X-ray-damaged merged data sets (left to right) with 1 − S 2 values plotted on the structure of each protein. Note that the scales differ to best visualize each protein. The diameter of the worm representation is correlated with the magnitude of the 1 − S 2 values. The zero-dose 1 − S 2 and the 1 − S 2 from the least damaged data sets are qualitatively and quantitatively similar (see also Supplementary Fig. S11).

