Figure 5.
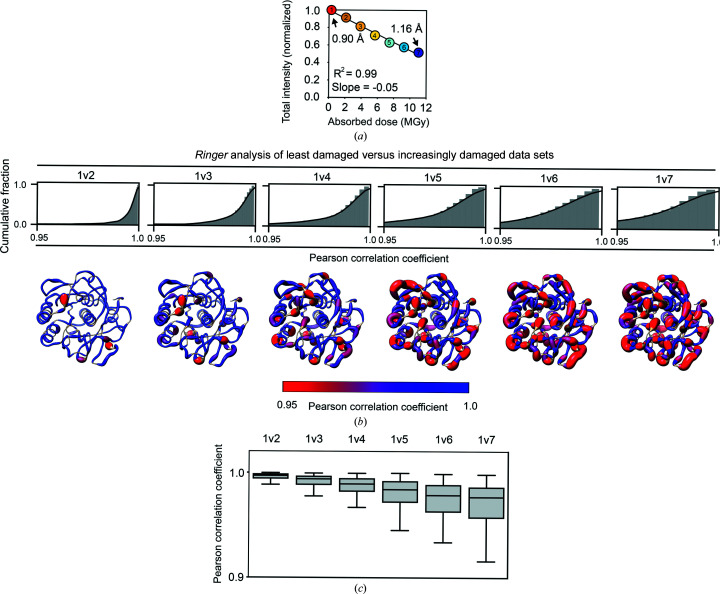
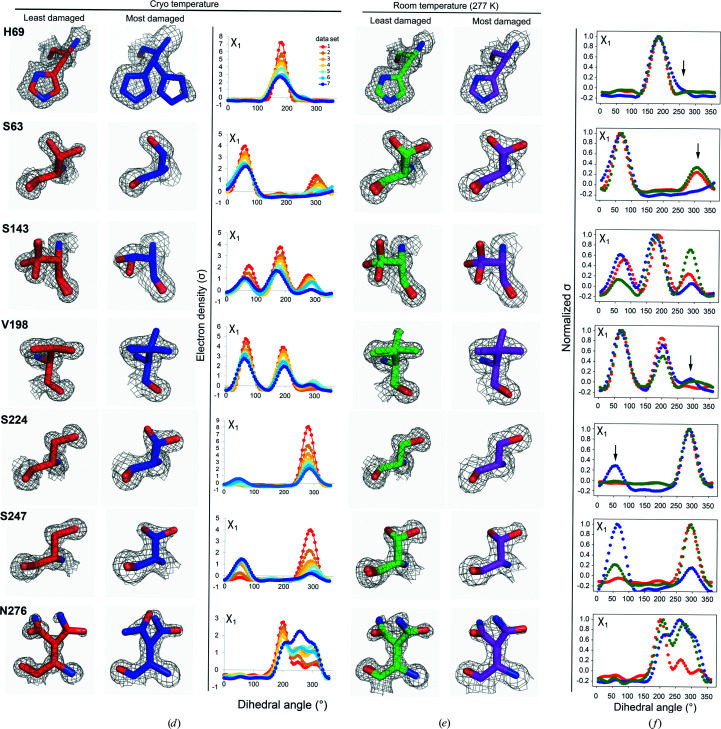
X-ray damage to cryo-cooled crystals can alter protein side-chain rotameric distributions. (a) Plot of the normalized total intensity versus absorbed dose for sequential X-ray-damaged data sets collected at 100 K from the same orientation of a single proteinase K crystal (Supplementary Table S11). The resolutions of the least and most damaged cryo data sets are indicated and the increasingly X-ray-damaged data sets are labeled with numbers from 1 (least X-ray damaged) to 7 (most X-ray damaged). (b) Cumulative fraction and (c) boxplots of Pearson correlation coefficients between the Ringer profiles for all residues in the least and increasingly damaged sequential cryo data sets. In (b) the lower row shows P CC values plotted on the proteinase K structure. The diameter of the worm representation is inversely correlated with the magnitude of P CC. (Supplementary Figs. S13–S18 show the Ringer plots for all residues with P CC ≤ 0.95.) The numbers above the cumulative plots indicate the data sets compared; for example ‘1v2’ indicates a comparison of data set 1 versus data set 2. (d–f) A subset of residues with a P CC of ≤0.95. (d) Left and middle columns: the least (data set 1) and most (data set 7) damaged cryo data sets; residues are shown as sticks. Electron density is shown as a gray mesh and is contoured at 1σ for all residues except His69, for which the contour is at 0.4σ. Right: raw Ringer profiles for the residues in (d) from the sequential X-ray-damaged data sets; the colors correspond to those in (a). (e) The same residues as in (d) but from the least (data set 1) and most (data set 4) damaged RT data sets. Electron density is shown as a gray mesh as in (d). (f) Normalized Ringer profiles for the residues in (d) and (e): the least and most damaged 100 K data sets are shown in red and blue, respectively, with the least damaged RT data set shown in green. Arrows show the appearance or disappearance of peaks. The RT Ringer profiles were obtained from electron-density maps with resolution matched to the resolution of the 100 K data sets (i.e. 1.16 Å).


