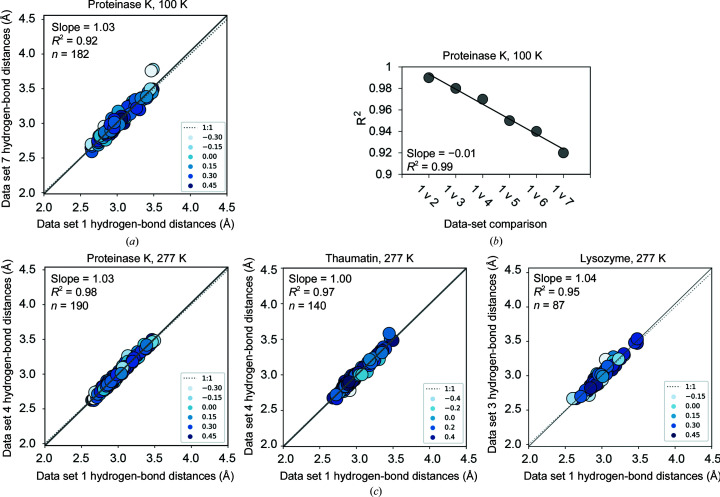
Figure 6.
X-ray damage impacts the determination of hydrogen-bond lengths more at cryo temperature than at RT (277 K). (a) Correlation plots of hydrogen-bond lengths obtained from the least and most sequential X-ray-damaged data sets at cryo temperature. Correlation points are colored according to the relative B factor of the hydrogen-bonding groups such that higher values (darker blue) and lower values (white) correspond to atoms with low and high B factors relative to the average, respectively (see Section 2). (b) Correlation coefficients (R 2) obtained from correlation plots of hydrogen-bond lengths from the least damaged (‘1’) and increasingly damaged proteinase K 100 K structures (‘2–7’) (see Supplementary Fig. S23 for individual correlation plots). Differences between proteinase K structures are unlikely to result from differences in refinement strategy as all structures were refined using the same refinement parameters and increasingly X-ray-damaged models were refined in a consistent manner (see Section 2). (c) Correlation plots of hydrogen-bond lengths obtained from the least and most sequential X-ray-damaged data sets at room temperature. Colors used are as in (a). The analysis excluded all residues with more than one conformation present in the model (see Section 2). Similar results were obtained with all residues included (Supplementary Fig. S24).

