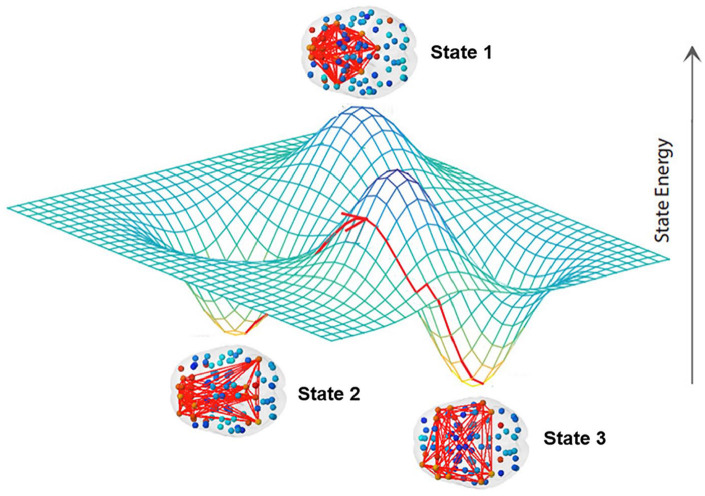
Figure 4.
A brain state consists in a set of regions with synchronized activity during a time interval. The three-dimensional plot represents the energy levels of each state and the red line with arrow on the energy landscape the dynamic trajectory of the brain moving from state to state, whereas “energy” here is a term derived from information criteria and not calculated from metabolic expenditure. Brain states are more or less likely to be visited by the dynamics over time based on their relative energy/stability (adapted from Gu and others 2018).

