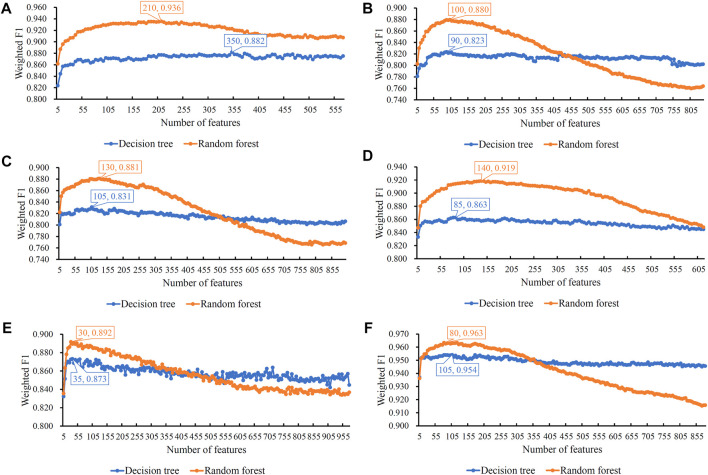
FIGURE 2.
Incremental feature selection (IFS) curves of two classification algorithms in six cell types. The weighted F1 is set to the Y-axis and the number of features is set to the X-axis. (A) IFS curves in B cells; (B) IFS curves in CD4+ T cells; (C) IFS curves in CD8+ T cells; (D) IFS curves in natural killer cells; (E) IFS curves in dendritic cells; and (F) IFS curves in monocytes. The highest weighted F1 on each curve is marked, along with the number of used features. The random forest can always provide better performance than the decision tree.

