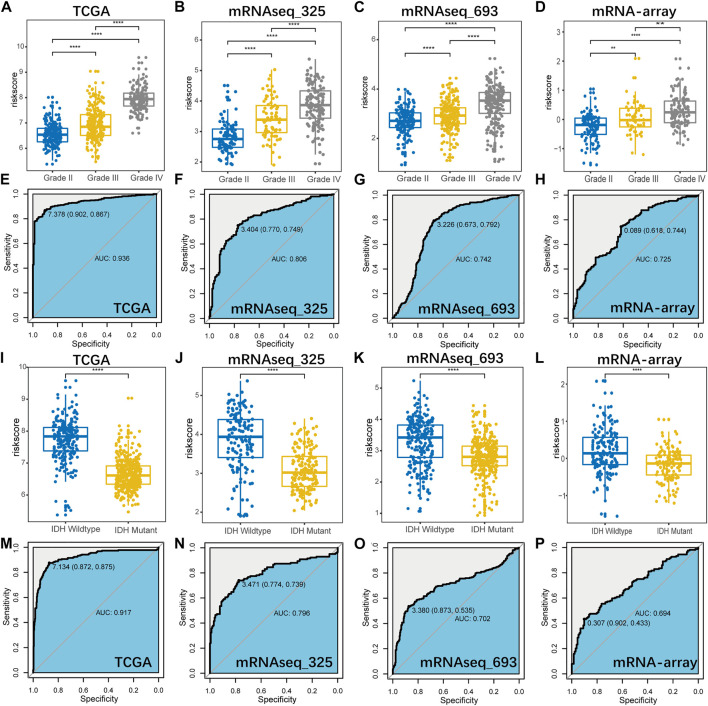
FIGURE 4.
The distribution of the signature-based risk scores in stratified patients by pathological grade (A–D) and IDH status (I–L) in all cohorts. ROC curve analysis showed that B7-CD28 family-based signature had highly sensitivity and specificity to predict pathological grade (E–H) and IDH status (M–P) in diffuse glioma. ∗∗, ∗∗∗ and ∗∗∗∗ represent p < 0.01, p < 0.001 and p < 0.0001, respectively.

