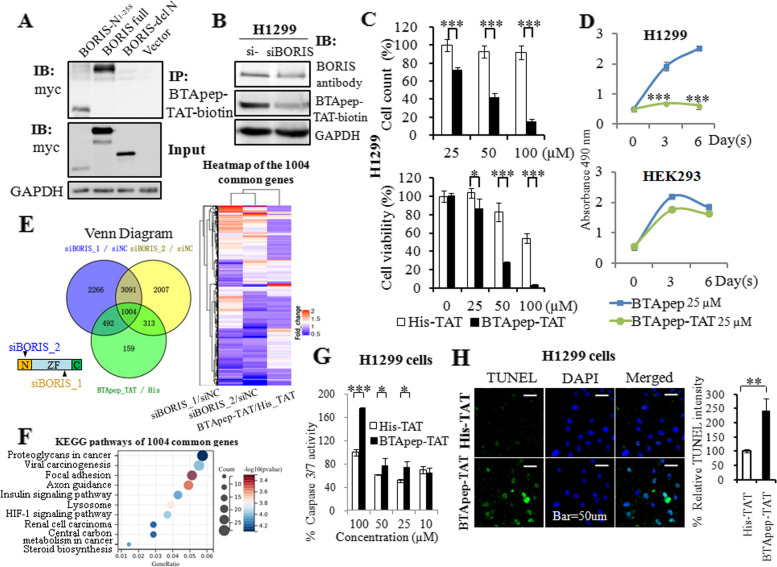
Fig. 2.
BTApep-TAT induced DNA damage and cancer cell apoptosis. (A) Co-immunoprecipitation was performed to evaluate the interaction of BTApep-TAT-biotin with BORIS-N1-258, full length BORIS, and BORIS-del N1-258 in the cell lysates from transfected H1299 cells. (B) The level of BORIS in H1299 cells after siRNA-mediated knockdown was evaluated by BORIS antibody or the BTApep-TAT-biotin peptide. (C) Cells were incubated with graded concentrations of the peptides (25–100 µM) for three days. MTT assays and cell counting were performed to evaluate the effect of BTApep-TAT and the negative control peptide His-TAT on H1299 cells. (D) H1299 and HEK293 cells were treated with 25 µM BTApep-TAT or BTApep to examine the effect of BTApep-TAT on cancer cells and normal cells (E) Transcriptomes of H1299 cells with siBORIS knockdown or BTApep-TAT treatment were compared. The left panel shows an overlap between siBORIS knockdowns and BTApep-TAT treatment in a Venn diagram. Two siRNAs targeting BORIS were used to compare the common genes in the heatmap. (F) A bubble map showing the pathways associated with the genes common to BORIS knockdown and BTApep-TAT treatment, which are shown in Panel E. (G) Caspase 3/7 assay detected the peptide-induced apoptosis at peptide concentrations from 10 to 100 µM. (H) A TUNEL assay detected the DNA damage induced by 25 µM peptide

