
Figure 2—
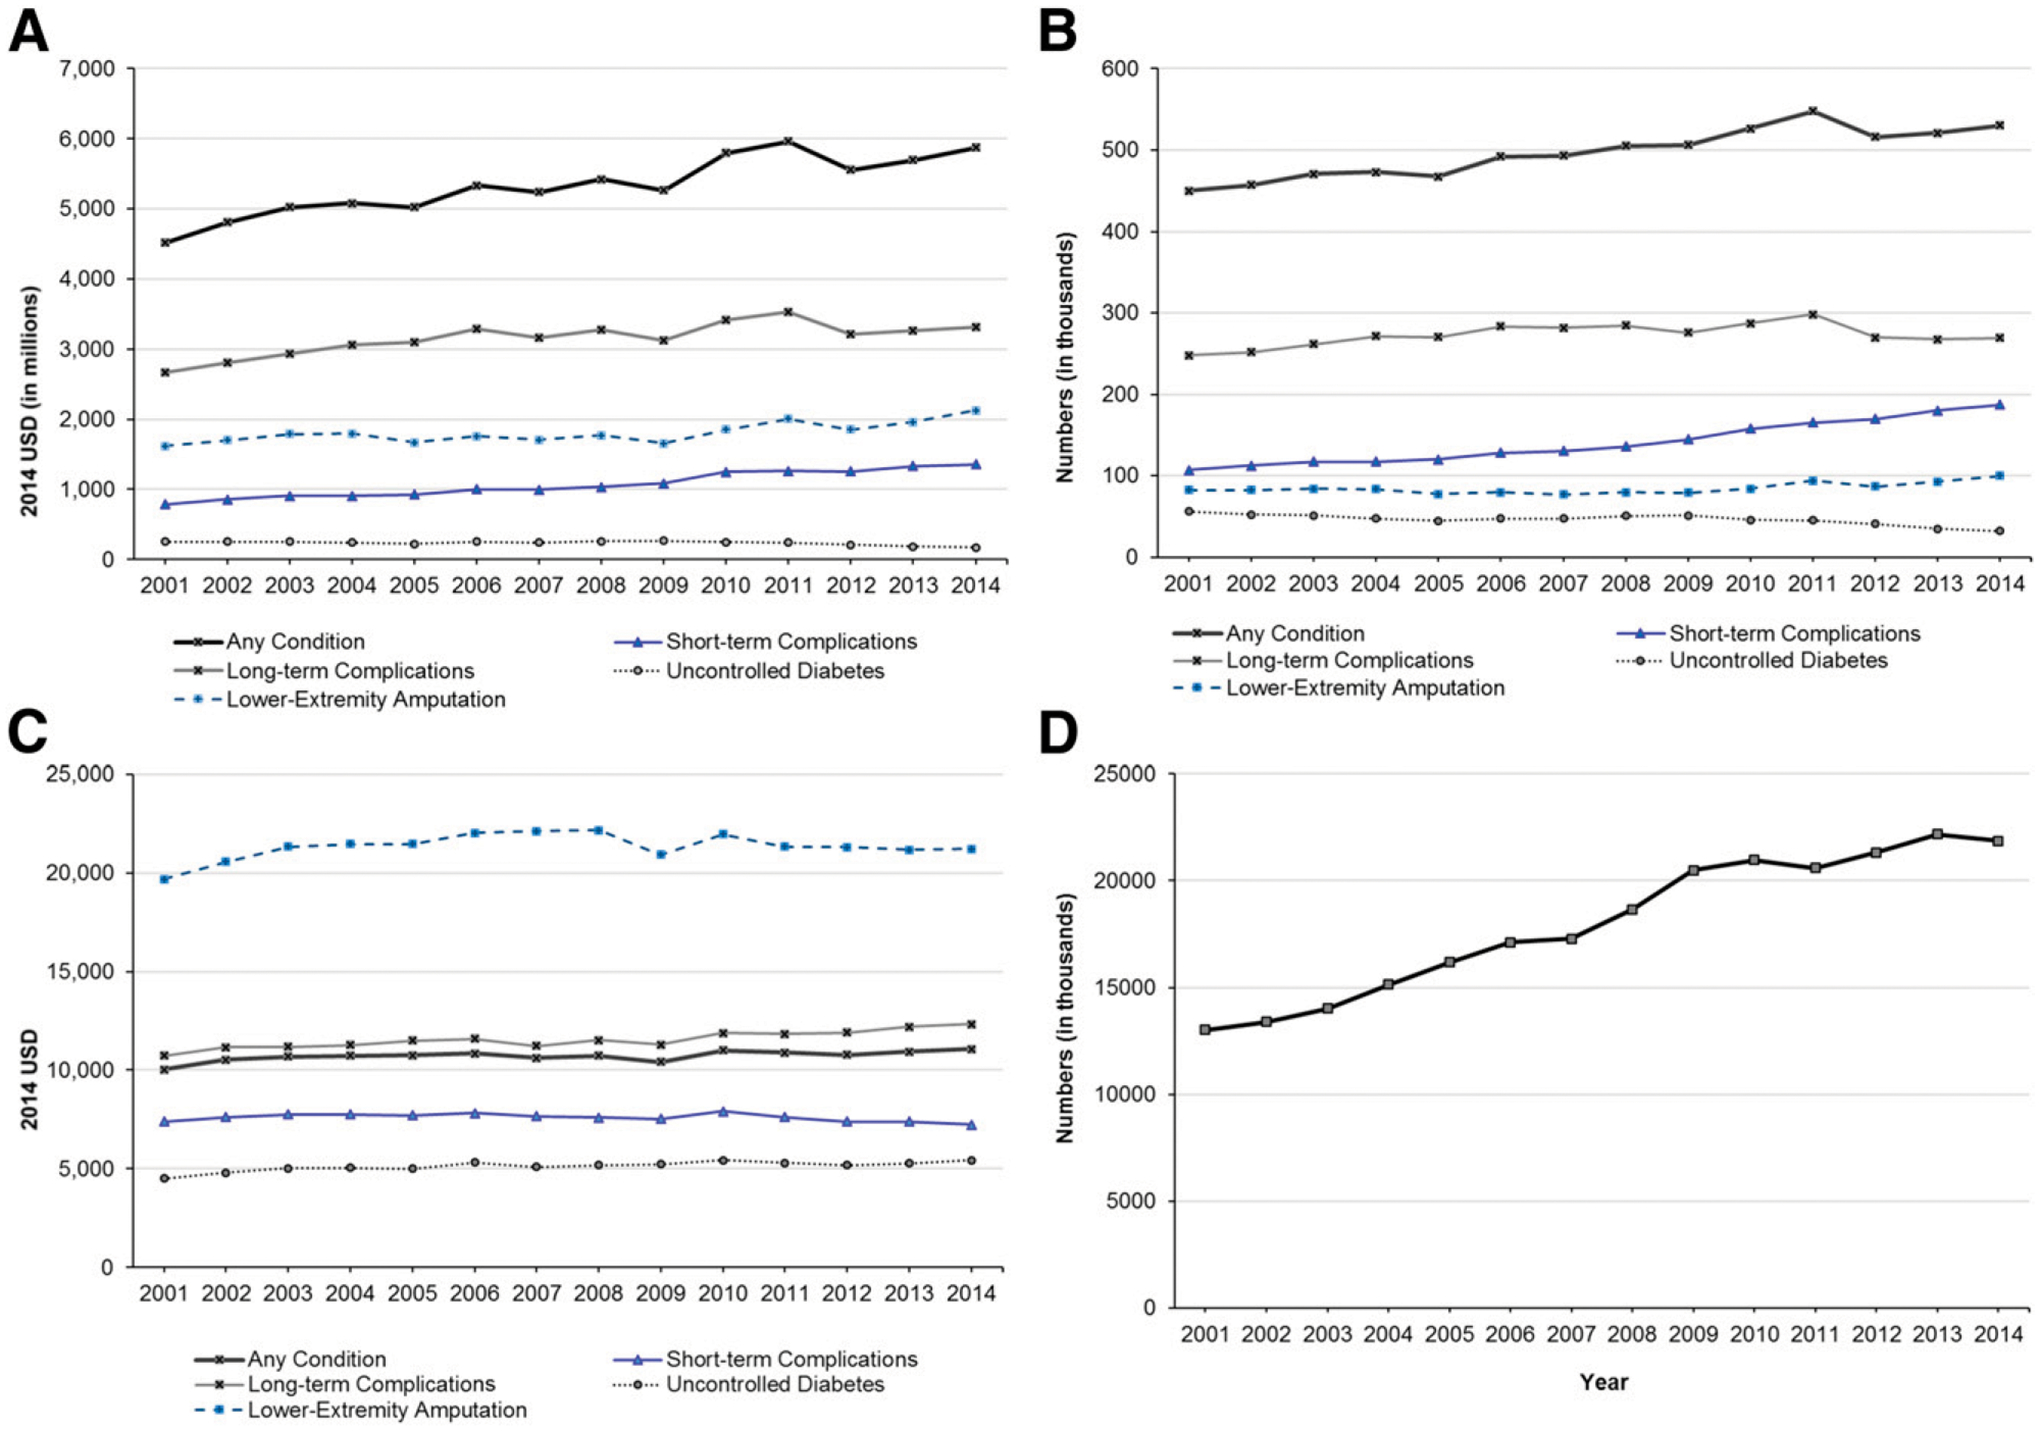
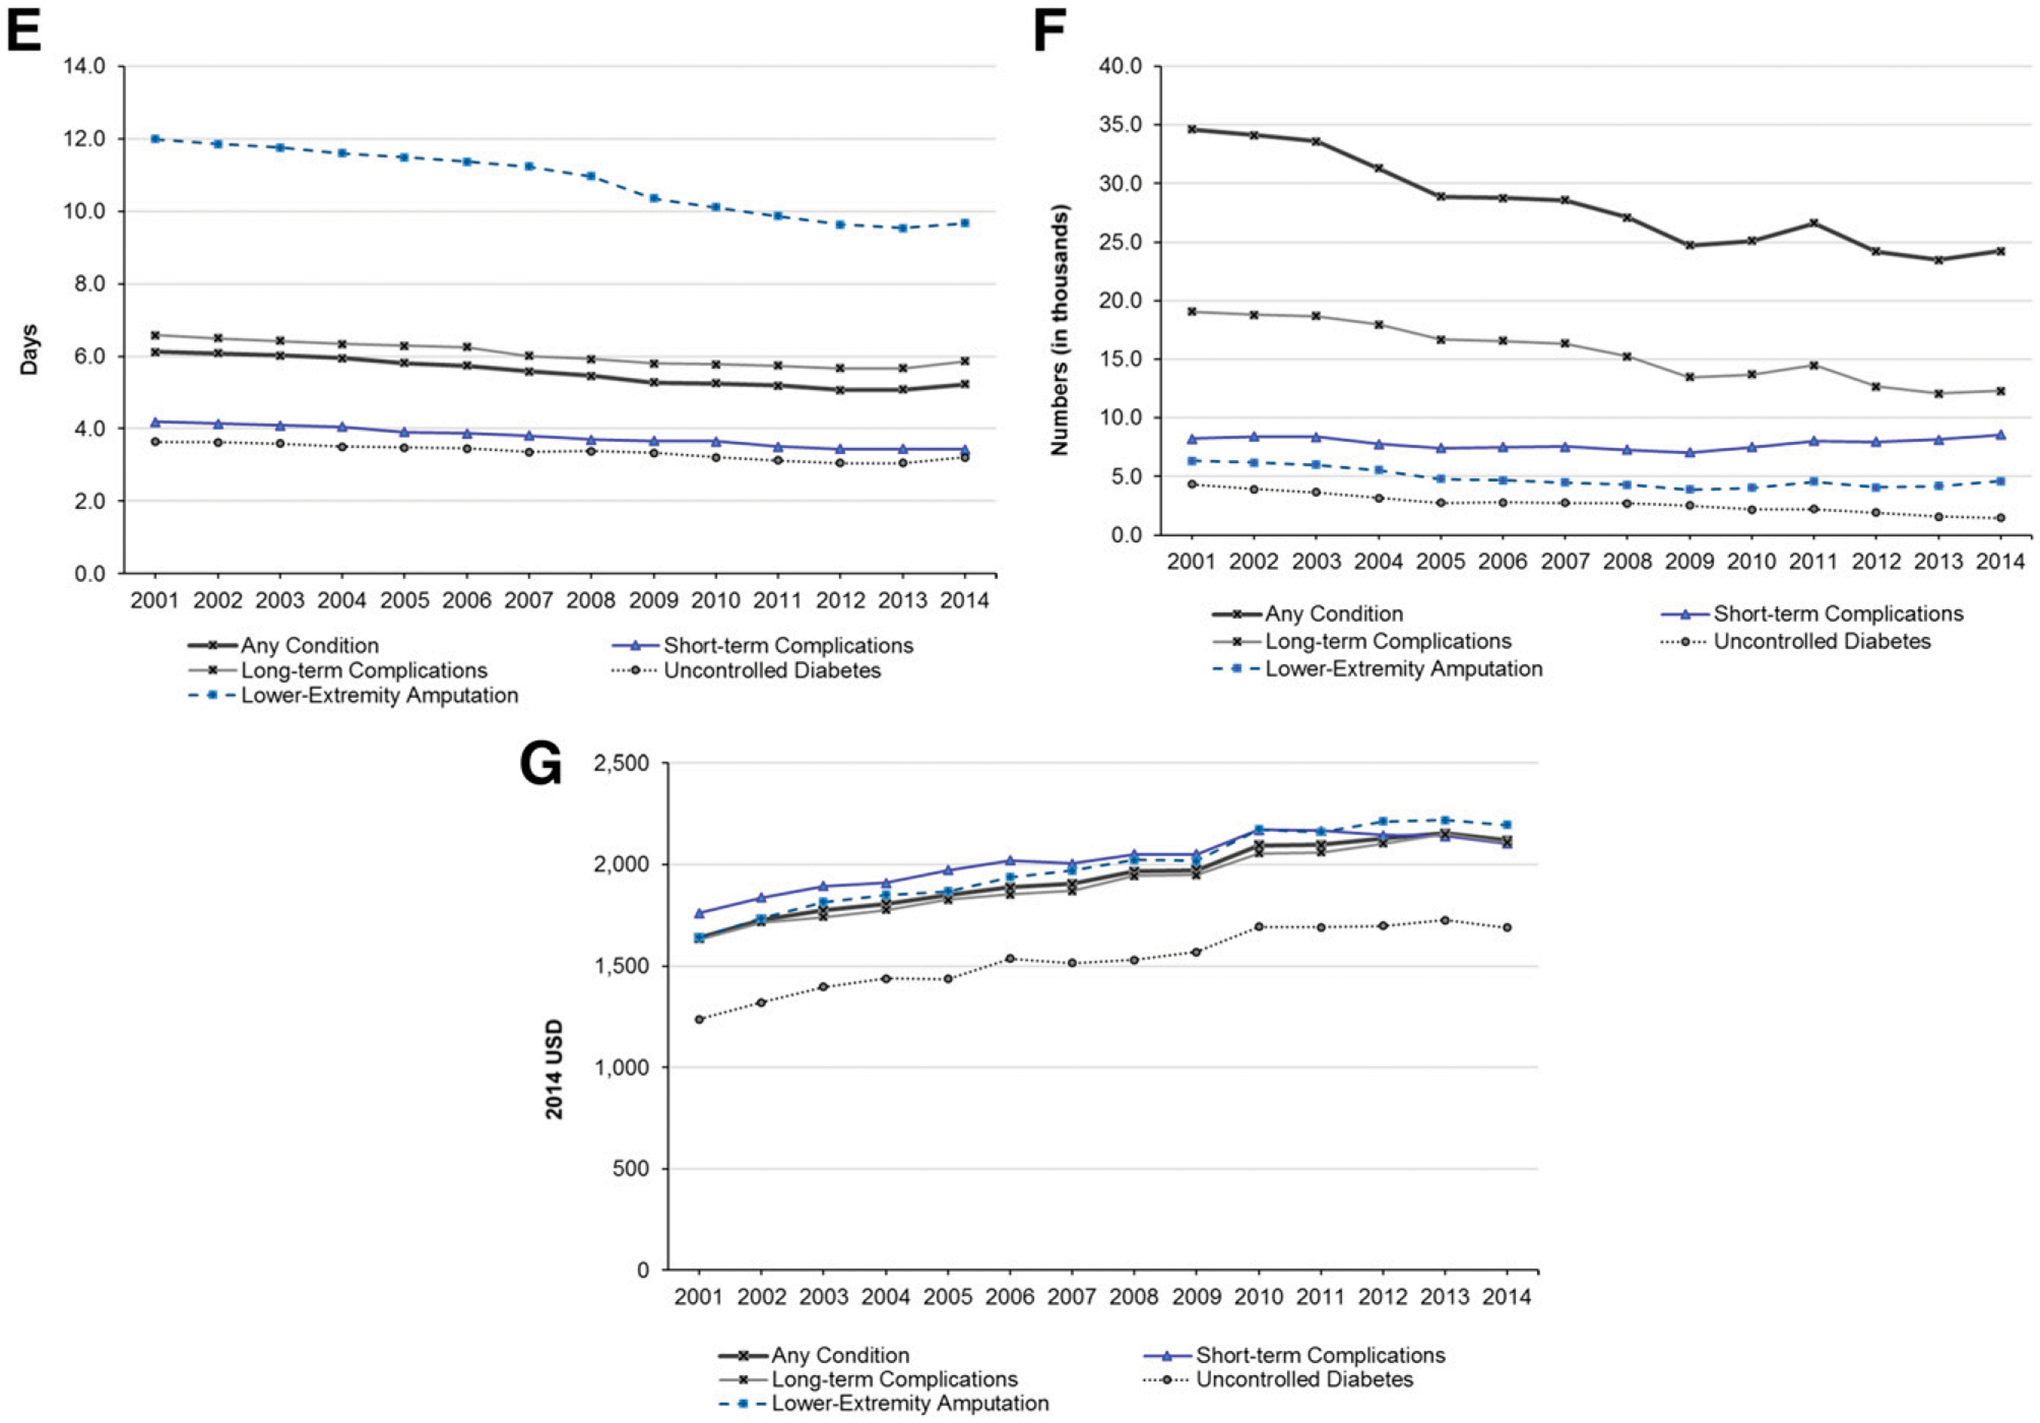
A–G:Trends in diabetes-related preventable hospitalizations overall and by level 1 and level 2contributing factors, total by condition, during 2001–2014. A: Total costs. B: Number of preventable hospitalizations. C: Mean cost per admission. D: Number of people with diabetes. E: Mean length of stay. F: Rate of preventable hospitalizations. G: Mean cost per day. Outcomes accounted for complex sampling design and trends weights for national estimates. Costs were adjusted to 2014 USD using the gross domestic product deflator.