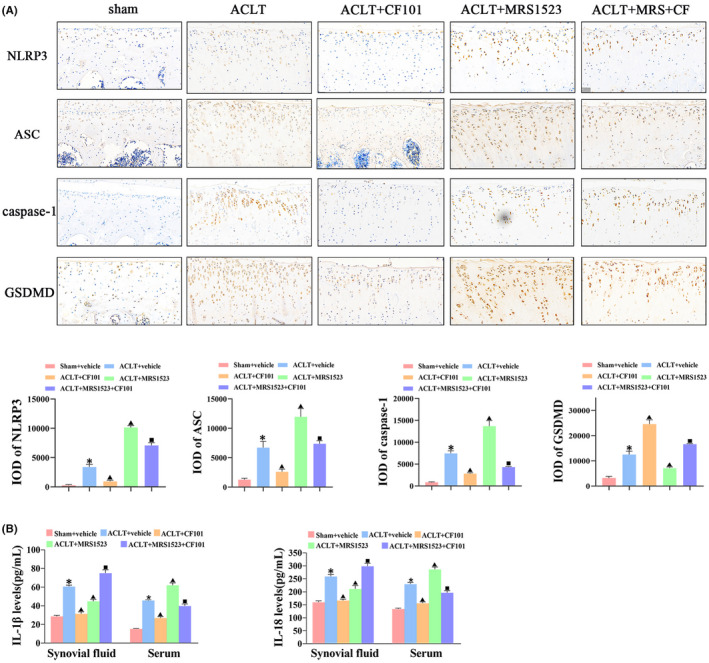
FIGURE 5.

Activation of A3AR inhibited GSDMD cleavage and production of pro‐inflammatory cytokines in articular cartilage in vivo. (A) IHC analysis of NLRP3, ASC, caspase‐1 and GSDMD in tibial plateau of cartilage (n = 3, the positive stained chondrocytes in three central regions of articular cartilage were counted using Image Pro Plus version 6.0 software), Original magnification × 200. (B) Elisa assay of IL‐1β and IL‐18 in synovial fluid and serum after CF101 treatment (n = 6). Values are the mean ± SEM; *p < 0.05 vs. Sham group. ▲ p < 0.05, vs. ACLT group. ■ p < 0.05, vs. ACLT + CF101 group
