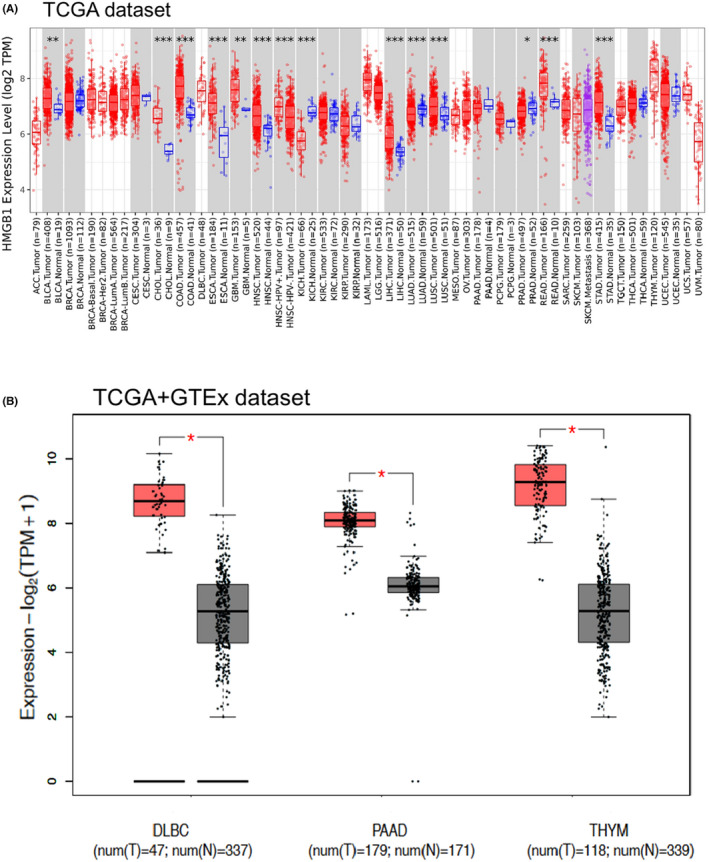
FIGURE 1.

RNA expression of HMGB1 in different tumours using TCGA and GTEx datasets. (A) The expression status of the HMGB1 in different cancers or specific cancer subtypes was analysed through TIMER2. *p < 0.05; **p < 0.01; ***p < 0.001. (B) For the type of DLBC, PAAD and THYM in the TCGA project, the corresponding normal tissues of the GTEx database were included as controls. The red colour represents tumour groups, and grey represents normal controls
