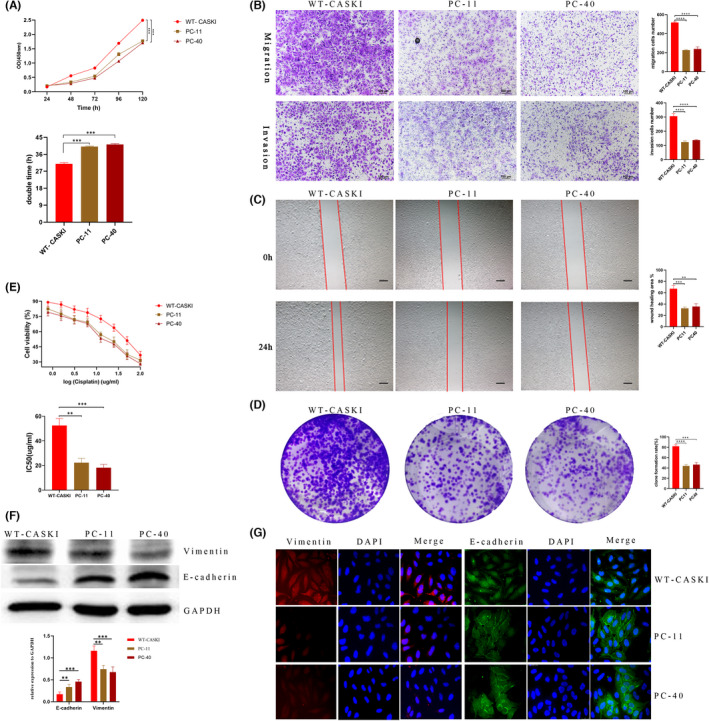
FIGURE 2.

Effects of PLD1 on the biological characteristics of CASKI cells. (A) The CCK‐8 assay growth curves showed that the proliferation activity of PC‐11 and PC‐40 cells was significantly inhibited in comparison to that of WT‐CASKI cells. (B) In the Matrigel migration/invasion assays, PC‐11 and PC‐40 cells demonstrated a significantly weaker ability to migrate and invade than WT‐CASKI cells (both p < 0.001). (C) For the scratch assays, PC‐11 and PC‐40 cells had significantly lower migration area percentages than WT‐CASKI cells (32.55 ± 1.68% and 35.62 ± 4.02% vs. 67.01 ± 4.69%, both p < 0.001) (D) Colony formation assays showed that the colony formation rate of PC‐11 and PC‐40 cells were both significantly reduced (43.93 ± 2.11% and 46.47 ± 3.28% vs. 82.00 ± 2.54%; all p < 0.01, respectively). In addition, the colonies formed by PC‐11 and PC‐40 cells were thinner than those formed by WT‐CASKI cells. (E) PC‐11 and PC‐40 cells exhibited higher sensitivity to cisplatin and the IC50 values significantly decreased in comparison with WT‐CASKI cells (22.25 ± 3.52 μg/mL and 18.12 ± 2.72 μg/mL vs. 52.45 ± 5.67 μg/mL, p = 0.0014 and 0.0007, respectively). (F, G) Western blot and immunocytochemistry results showed that vimentin was poorly expressed, whereas E‐cadherin was highly expressed in PC‐11 and PC‐40 cells. *p < 0.05, **p < 0.01, ***p < 0.001, ****p < 0.0001
