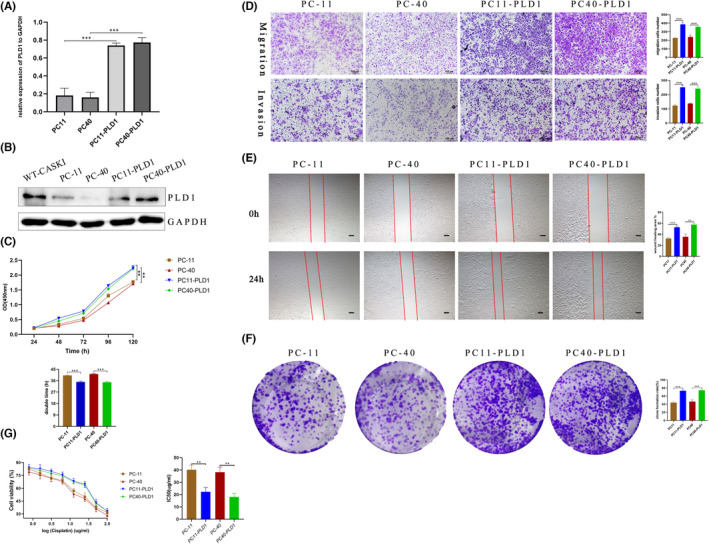
FIGURE 3.

Effects of PLD1 overexpression on the biological characteristics of CASKI cells. (A) qRT–PCR was used to verify the PLD1 mRNA level. (B) Western blot analysis confirmed that the expression of PLD1 was significantly increased in PC11‐PLD1 and PD40‐PLD1 cells. (C) The CCK‐8 assay growth curves suggested that PC11‐PLD1 and PC40‐PLD1 cells proliferated faster than PC11 and PC‐40 cells, and the doubling time of PC11‐PLD1 and PC40‐PLD1 cells was significantly shortened in comparison to that of PC‐11 and PC‐40 cells (35.05 ± 0.68 h vs. 40.11 ± 0.28 h, 34.78 ± 0.76 h vs. 41.27 ± 0.40 h, respectively, all p < 0.05). (D) Matrigel migration/invasion assay results showed that PC11‐PLD1 and PC40‐PLD1 cells showed a higher ability to invade and migrate than PC‐11 and PC‐40 cells. (E) The scratch assay results showed that PC11‐PLD1 and PC40‐PLD1 cells had significantly higher migration area percentages than PC‐11 and PC‐40 cells (52.85 ± 2.0% vs. 32.55 ± 1.70%, 57.54 ± 1.80% vs. 35.62% ± 4.02%, all p < 0.001). (F) Colony formation assays showed that the colony formation rate of PC11‐PLD1 and PC40‐PLD1 cells was significantly greater than that formed by the two PLD1 knockout cells (43.93 ± 2.11% vs. 73 ± 1.72%, 46.47 ± 3.28% vs. 74.4 ± 2.27%, all p < 0.01). (G) PC11‐PLD1 and PC40‐PLD1 showed lower sensitivity to cisplatin, and the IC50 values significantly increased compared with those of PC‐11 and PC‐40 cells (40.20 ± 3.59 μg/mL vs. 22.25 ± 3.52 μg/mL, 38.15 ± 4.26 μg/mL vs. 18.12 ± 2.72 μg/mL, p = 0.0035 and 0.0024, respectively)
