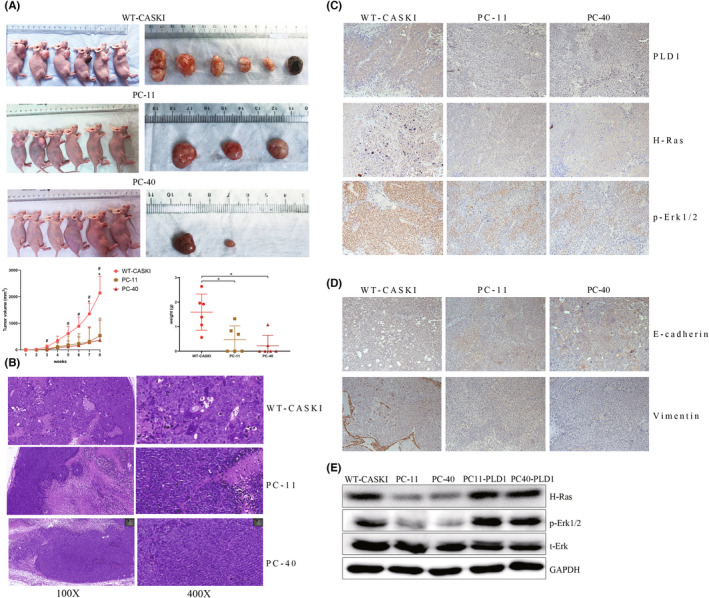
FIGURE 4.

PLD1 knockout inhibits tumour growth in vivo. (A) PC‐11 and PC‐40 cells had smaller tumours than WT‐CASKI cells, and the nude mouse tumorigenesis rate was lower than that in the WT‐CASKI group (50% and 33.3% vs. 100%). Tumour weight. Data are presented as the mean ± SD. Growth curves of tumour volumes. (B) HE results showed that tumour differentiation of PC‐11 and PC‐40 cells was significantly better than that of WT‐CASKI cells. (C) The representative images of p‐ERK1/2 and H‐Ras immunohistochemical staining in tumour tissues. (D) The representative images of E‐cadherin and vimentin immunohistochemical staining in tumour tissues. (E) The WB results showed that the expression of p‐ERK1/2 and H‐Ras was significantly decreased in PC‐11 and PC‐40 cells compared with WT‐CASKI cells (p = 0.0066 and 0.0031, p = 0.0005 and 0.0007, respectively). In PC11‐PLD1 and PC40‐PLD1 cells, the expression of p‐ERK1/2 and H‐Ras was significantly increased compared with that in PC‐11 and PC‐40 cells (all p < 0.05). *p < 0.05, **p < 0.01, ***p < 0.001, #p < 0.05, ##p < 0.01, ###p < 0.001
