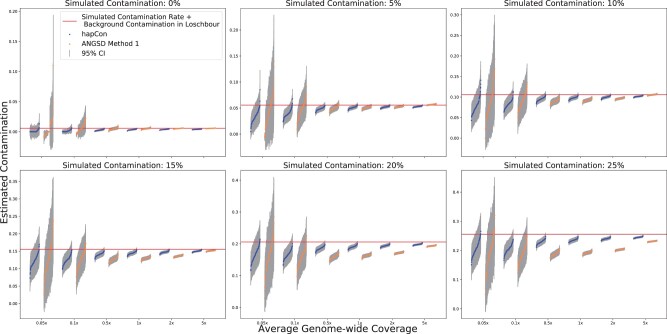
Fig. 3.
Performance comparison between ANGSD and hapCon on 1240k panel with simulated contaminated BAM files. We simulated contaminated BAM files by mixing two BAM files, using Loschbour as the endogenous source and B_French-3 as the contaminant source. We simulated contamination rate ranging from 0% to 25% with steps of 5%, and average genome-wide coverages at 5×, 2×, 1×, 0.5×, 0.1× and 0.05×. 100 replicates were created for each simulation scenario and analyzed with both hapCon and ANGSD. Contamination estimates are visualized in groups of replicates next to each other. Each represents the estimate for one replicate, and they are ordered from low to high within each replicate group. The estimated contamination from Loschbour (0.5674%, 95% CI: 0.5669–0.5679%, estimated by ANGSD) was added to the simulated contamination rate (red horizontal line) (A color version of this figure appears in the online version of this article.)

