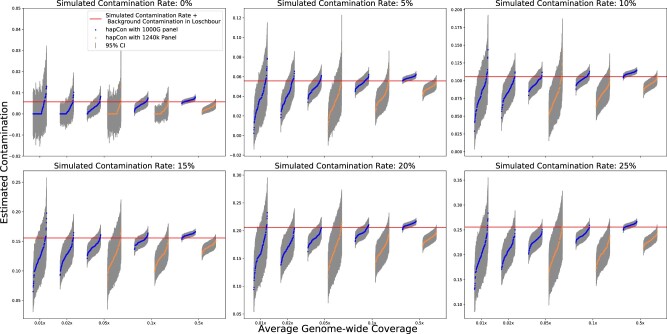
Fig. 4.
Performance comparison between two reference panels with simulated contaminated BAM files. We simulated contaminated BAM files as described in Figure 3. We simulated average genome wide coverage at 0.5×, 0.1×, 0.05×, 0.02× and 0.01×. We ran hapCon with 1000G panel on all these coverages and compared it with hapCon with 1240k on coverage 0.5×, 0.1× and 0.05×. We did not plot the results of hapCon with 1240k panel on simulated coverage 0.02× and 0.01× because the huge variance of the estimates in such low coverage regime conceals other important trends

