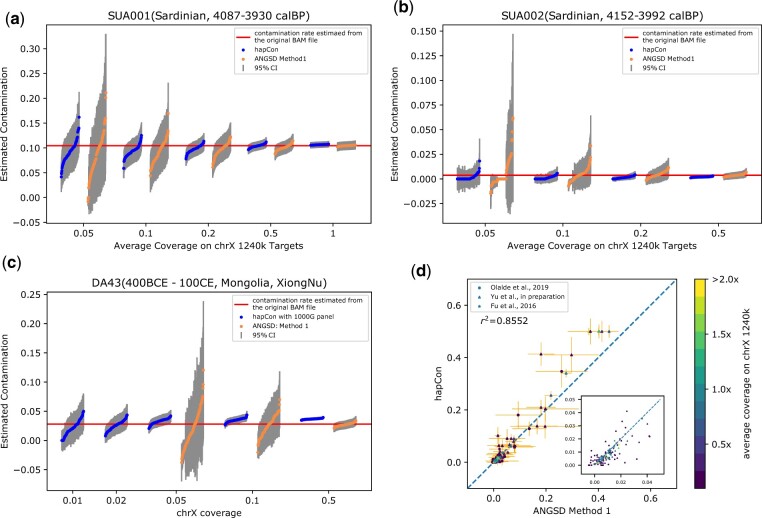
Fig. 5.
Assessing performance on empirical aDNA Data. (a, b) We performed downsampling experiments on 1240k data of two Sardinian samples, SUA001 and SUA002, both from Marcus et al. (2020). The original BAM files were down-sampled to various coverages with 100 independent replicates for each coverage. (a) Comparison between our method and ANGSD on SUA001, estimated to be 10.45% (95% CI: 9.56–11.34%) contaminated by ANGSD (on full data, visualized by the horizontal red line). (b) Comparison between our method and ANGSD on SUA002, estimated to be 0.38% (95% CI: 0.072–0.69%) contaminated by ANGSD (on full data, visualized by the horizontal red line). (c) We down-sampled WGS data of DA43, XiongNu, Mongolia from de Barros Damgaard et al. (2018). The original BAM file for DA43 was down-sampled to various coverages 0.01–0.5×, with 100 independent replicates for each target coverage. We only visualized ANGSD’s results on 0.05×, 0.1×, 0.5× because its estimates at coverage lower than 0.05× were highly variable. DA43 is estimated to be 2.83 % (95% CI: 2.35–3.31%) contaminated by ANGSD (on full data, visualized by the horizontal red line). (d) We compared our new method and ANGSD on 1240k aDNA data of 89 samples from the Iberian Peninsula and of 66 Eurasian hunter-gatherers. The true contamination rate is unknown. No down-sampling was performed and all individuals (dots) are color coded by the average coverage on 1240k SNPs on chromosome X. The inlet visualizes a zoom-in into . A similar figure that only shows the Eurasian hunter-gatherers is available in Supplementary Figure S13

