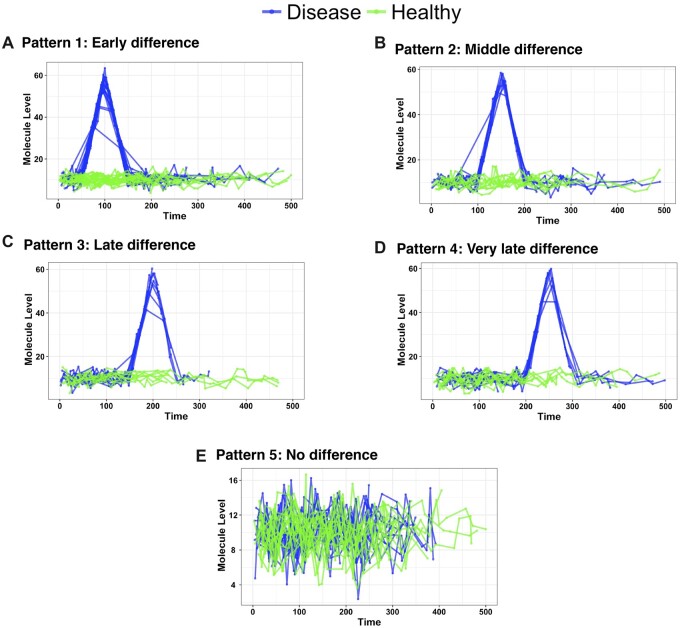
Fig. 2.
Examples of simulated features from the 5 patterns we have in this study. The first pattern indicates that the change between the two groups happened 50 days from the start of the perturbation and lasts till 150 days, Pattern 2 shows differences between 100 and 200, Pattern 3 shows differences between 150 and 250, Pattern 4 shows differences between 200 and 300, Pattern 5 has no change at all between the two groups and act as a negative control

