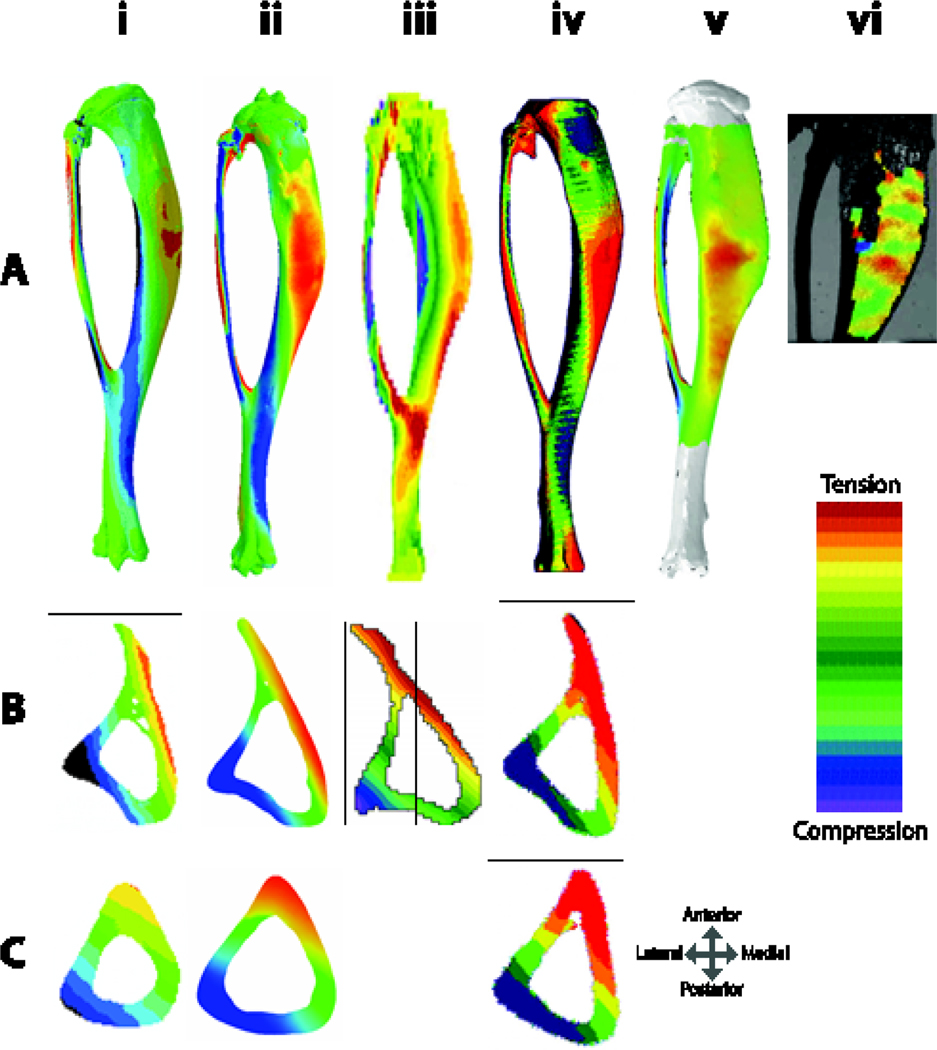
Figure 4:
(A) Finite element models of murine tibiae with simulated applied axial compressive loads from i.) based on 110 ii.) 114 iii.) 111, iv.) 105, and v.) 112. vi.) DIC of surface strains 108. All tibiae in (A) are viewed from the medial surface, except (iii) which is in lateral view. Tibiae shown are from mice of different ages and model different applied load magnitudes, but one can appreciate that while there are some differences in whole bone strain patterns, (particularly ii and iii, which have high strains at the tibiofibular junction), strain distributions at the (B) mid-point between the proximal bone end and the tibiofibular junction (~37% bone length) and (C) mid-shaft (50% of bone length) have quite similar strain distributions, likely owing to the strong effect of the bone curvature on the induced strain environment.

