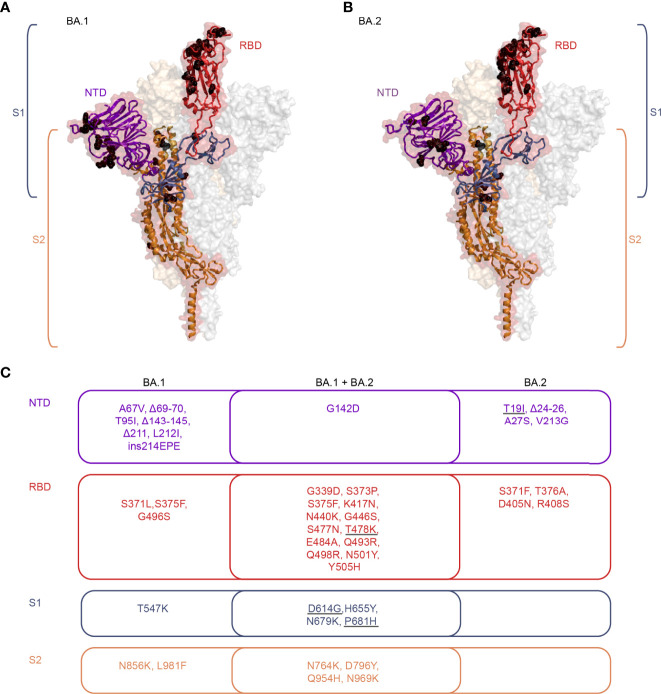
Figure 2.
Structural representation of mutations present in Omicron BA.1 and BA.2 sub-lineages. (A, B) Cartoon representation of one monomer of the spike protein (side view) combined with a semi-transparent surface representation of the trimeric spike in its RBD-up-conformation [PDB 7KRR, (25)]. The three protomers are colored in red, grey, and bright orange. The S1 subunit is colored blue in the single protomer, with the RBD highlighted in red and the NTD highlighted in purple. S2 is colored in orange. The black spheres indicate the mutations present in sub-lineages BA.1 (A) and BA.2 (B). The structures were generated with PyMol (https://pymol.org). (C) Venn diagram illustrating the BA.1 and BA.2 sub-lineage-specific and shared mutations, colored according to the regions highlighted in panels A and B. The grey underlines indicate mutations present in the Delta variant. RBD, Receptor-binding domain; NTD, N-terminal domain; S1, Subunit 1; S2, Subunit 2.

