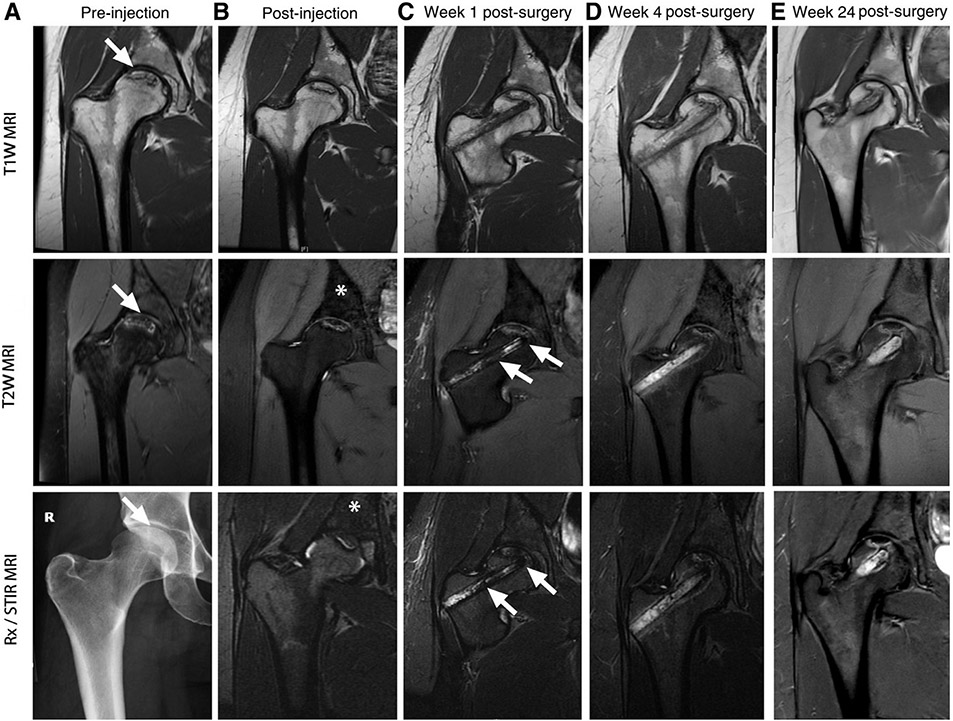
Figure 4.
Serial imaging of ferumoxytol-labeled bone marrow cells. (A) T1W, T2W and x-ray images of the right femur show osteonecrosis (arrows) in the femoral epiphysis with typical fat-equivalent center and serpiginous borders. (B) At 24 h after intravenous injection of ferumoxytol, the normal bone marrow in the iliac crest shows hypointense (dark) enhancement (asterisks) on T2-weighted MR images. (C) One week after core decompression and injection of iron-labeled bone marrow cells, a hypointense (dark) signal is noted in the decompression track (arrows), consistent with delivery of iron-labeled cells. (D,E) MRI follow-up at 4 weeks and 24 weeks after core decompression and transplantation of labeled cells shows decline in iron signal over time. The femoral epiphysis did not collapse during this 6-month follow-up period. Reproduced with permission from [63] © American Association for Cancer Research (2018). STIR, short tau inversion recovery; T1W, T1-weighted; T2W, T2-weighted.

