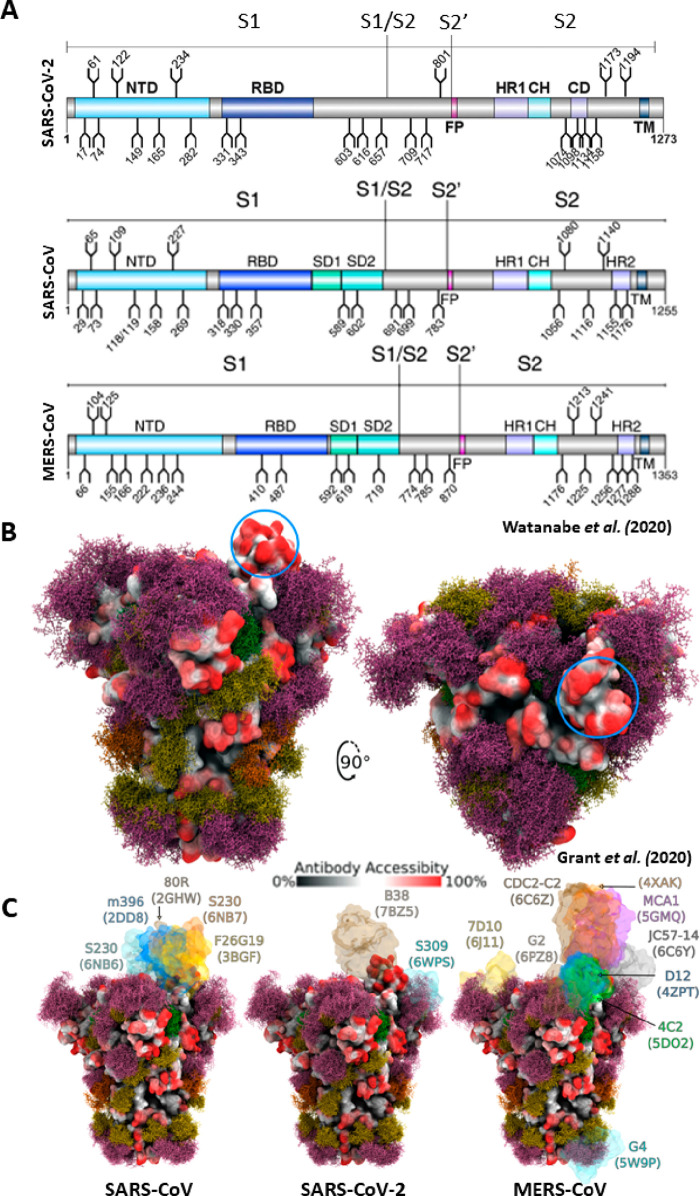
Figure 10.
Glycosylation of the SARS-CoV-2, SARS-CoV, and MERS-CoV spike proteins. (A) Schematic representation of the SARS-CoV-2, SARS-CoV, and MERS-CoV protein open reading frames with glycosylation sites indicated (refs (94 and 95)). Adapted with permission from ref (95). Copyright 2020 Watanabe et al. http://creativecommons.org/licenses/by/4.0/. (B) Moss surface representation of SARS-CoV-2 S protein glycosylation from molecular dynamic simulations performed by Grant et al. (ref (101)). Glycans are shown in ball-and-stick representations and colorized accordingly: M9, green; M5, dark yellow; hybrid, orange; complex, pink. The S protein surface (6VSB) is colored according to antibody accessibility from black (least accessible) to red (most accessible). The RBD in the up conformation is circled in blue. Adapted with permission from ref (101). Copyright 2020 Grant et al. http://creativecommons.org/licenses/by/4.0/. (C) The same as in panel B, but for SARS-CoV, SARS-CoV-2, and MERS-CoV S proteins and with available S protein–antibody structures overlapped.

