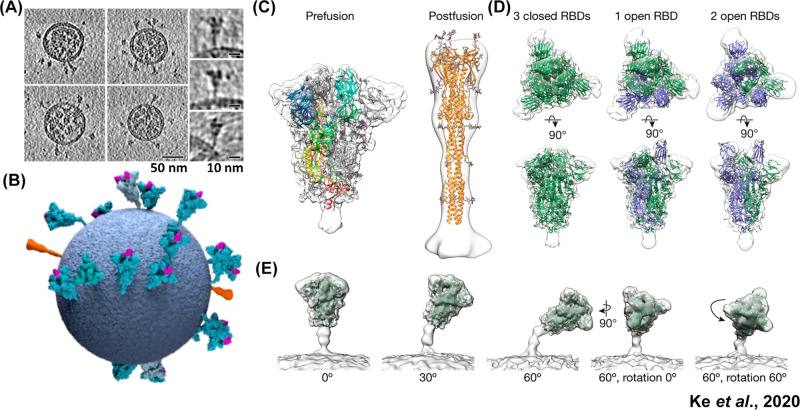
Figure 6.
Spike protein distribution, conformations, and tilt angles in authentic SARS-CoV-2 virions. (A) Tomographic slices of four representative SARS-CoV-2 virions and side projections of three individual S proteins. (B) Three-dimensional model of a single SARS-CoV-2 virion derived from subtomogram averaging. Prefusion S proteins are colored in blue with up RBDs colored pink. Postfusion S protein densities are colored in orange. (C) Prefusion and postfusion S protein trimer densities obtained by subtomogram averaging and fitted with PDBs 6VXX and 6XRA, respectively. (D) Prefusion trimer conformations as observed on intact virions. The densities corresponding to three closed, one open, and two open RBDs are fitted with PDBs 6VXX, 6VYB, and 6X2B, respectively, with protomers containing up RBDs colored in blue. (E) Averaging of trimer subsets is shown for pools centered at 0°, 30°, and 60° from the normal, as well as for two rotations of the S protein relative to the tilt direction. Adapted with permission from ref (53). Copyright 2020 Ke et al. http://creativecommons.org/licenses/by/4.0/.

