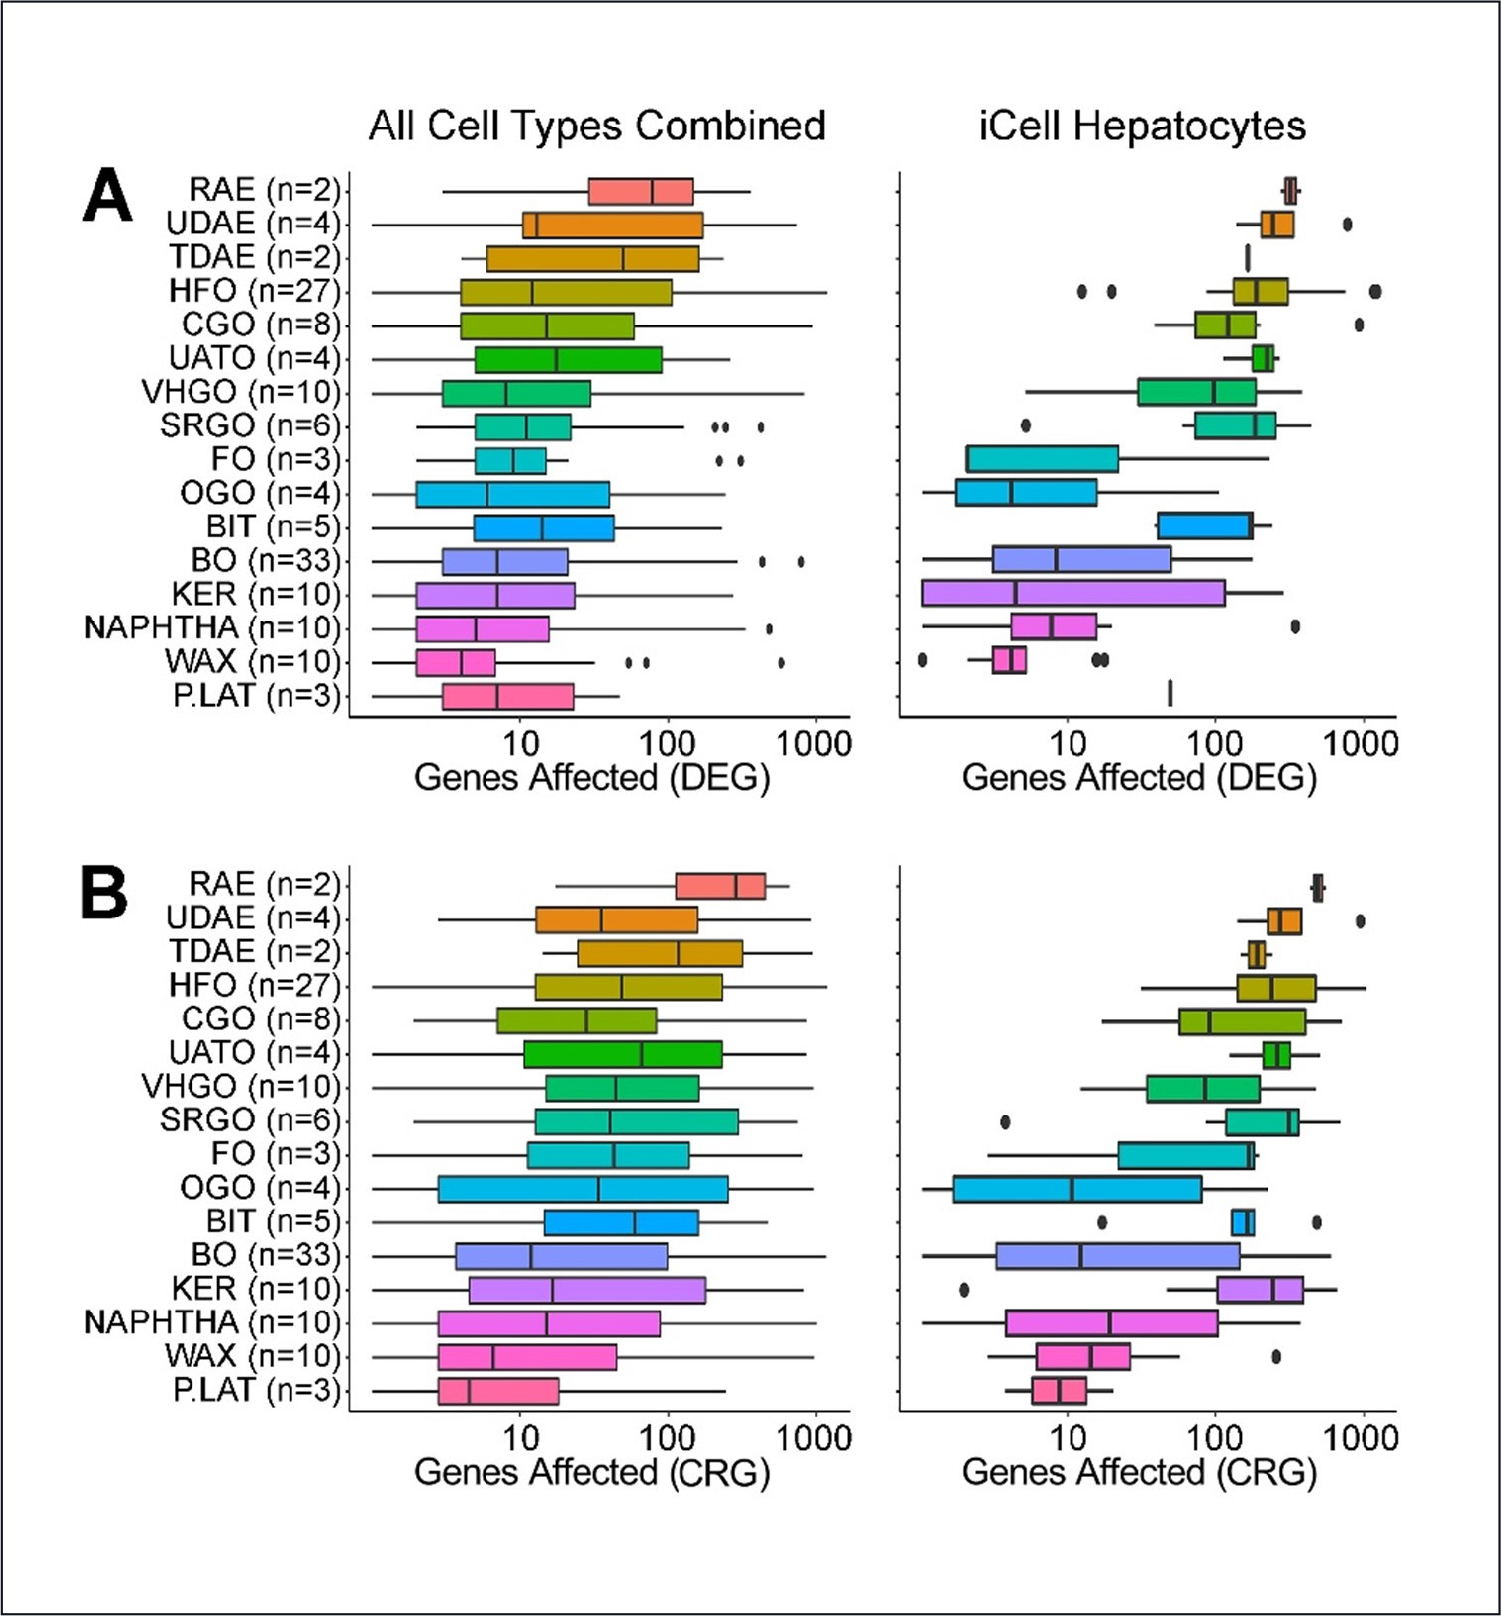
Fig. 3: Class-specific effects of petroleum substances on gene expression in the multi-cell in vitro transcriptomic analysis.

Box and whiskers plots show the range in the number of genes significantly (false discovery q ≤ 0.1, DeSeq2 analysis) affected by the substances in each class (numbers in each class shown as n). (A) Differentially expressed genes (DEG) were derived by comparing expression between the highest concentration of each substance (n = 2) with that in vehicle-treated cells (n ~45). (B) Concentration-response genes (CRG) were derived by analyzing the slope in gene expression trend with increasing concentration (n = 2 for each concentration and ~45 vehicle-treated). Shown are effects in all cell types (left panels) or in iCell hepatocytes (right panels). Data for each cell type are shown in Figures S3 and S41.
