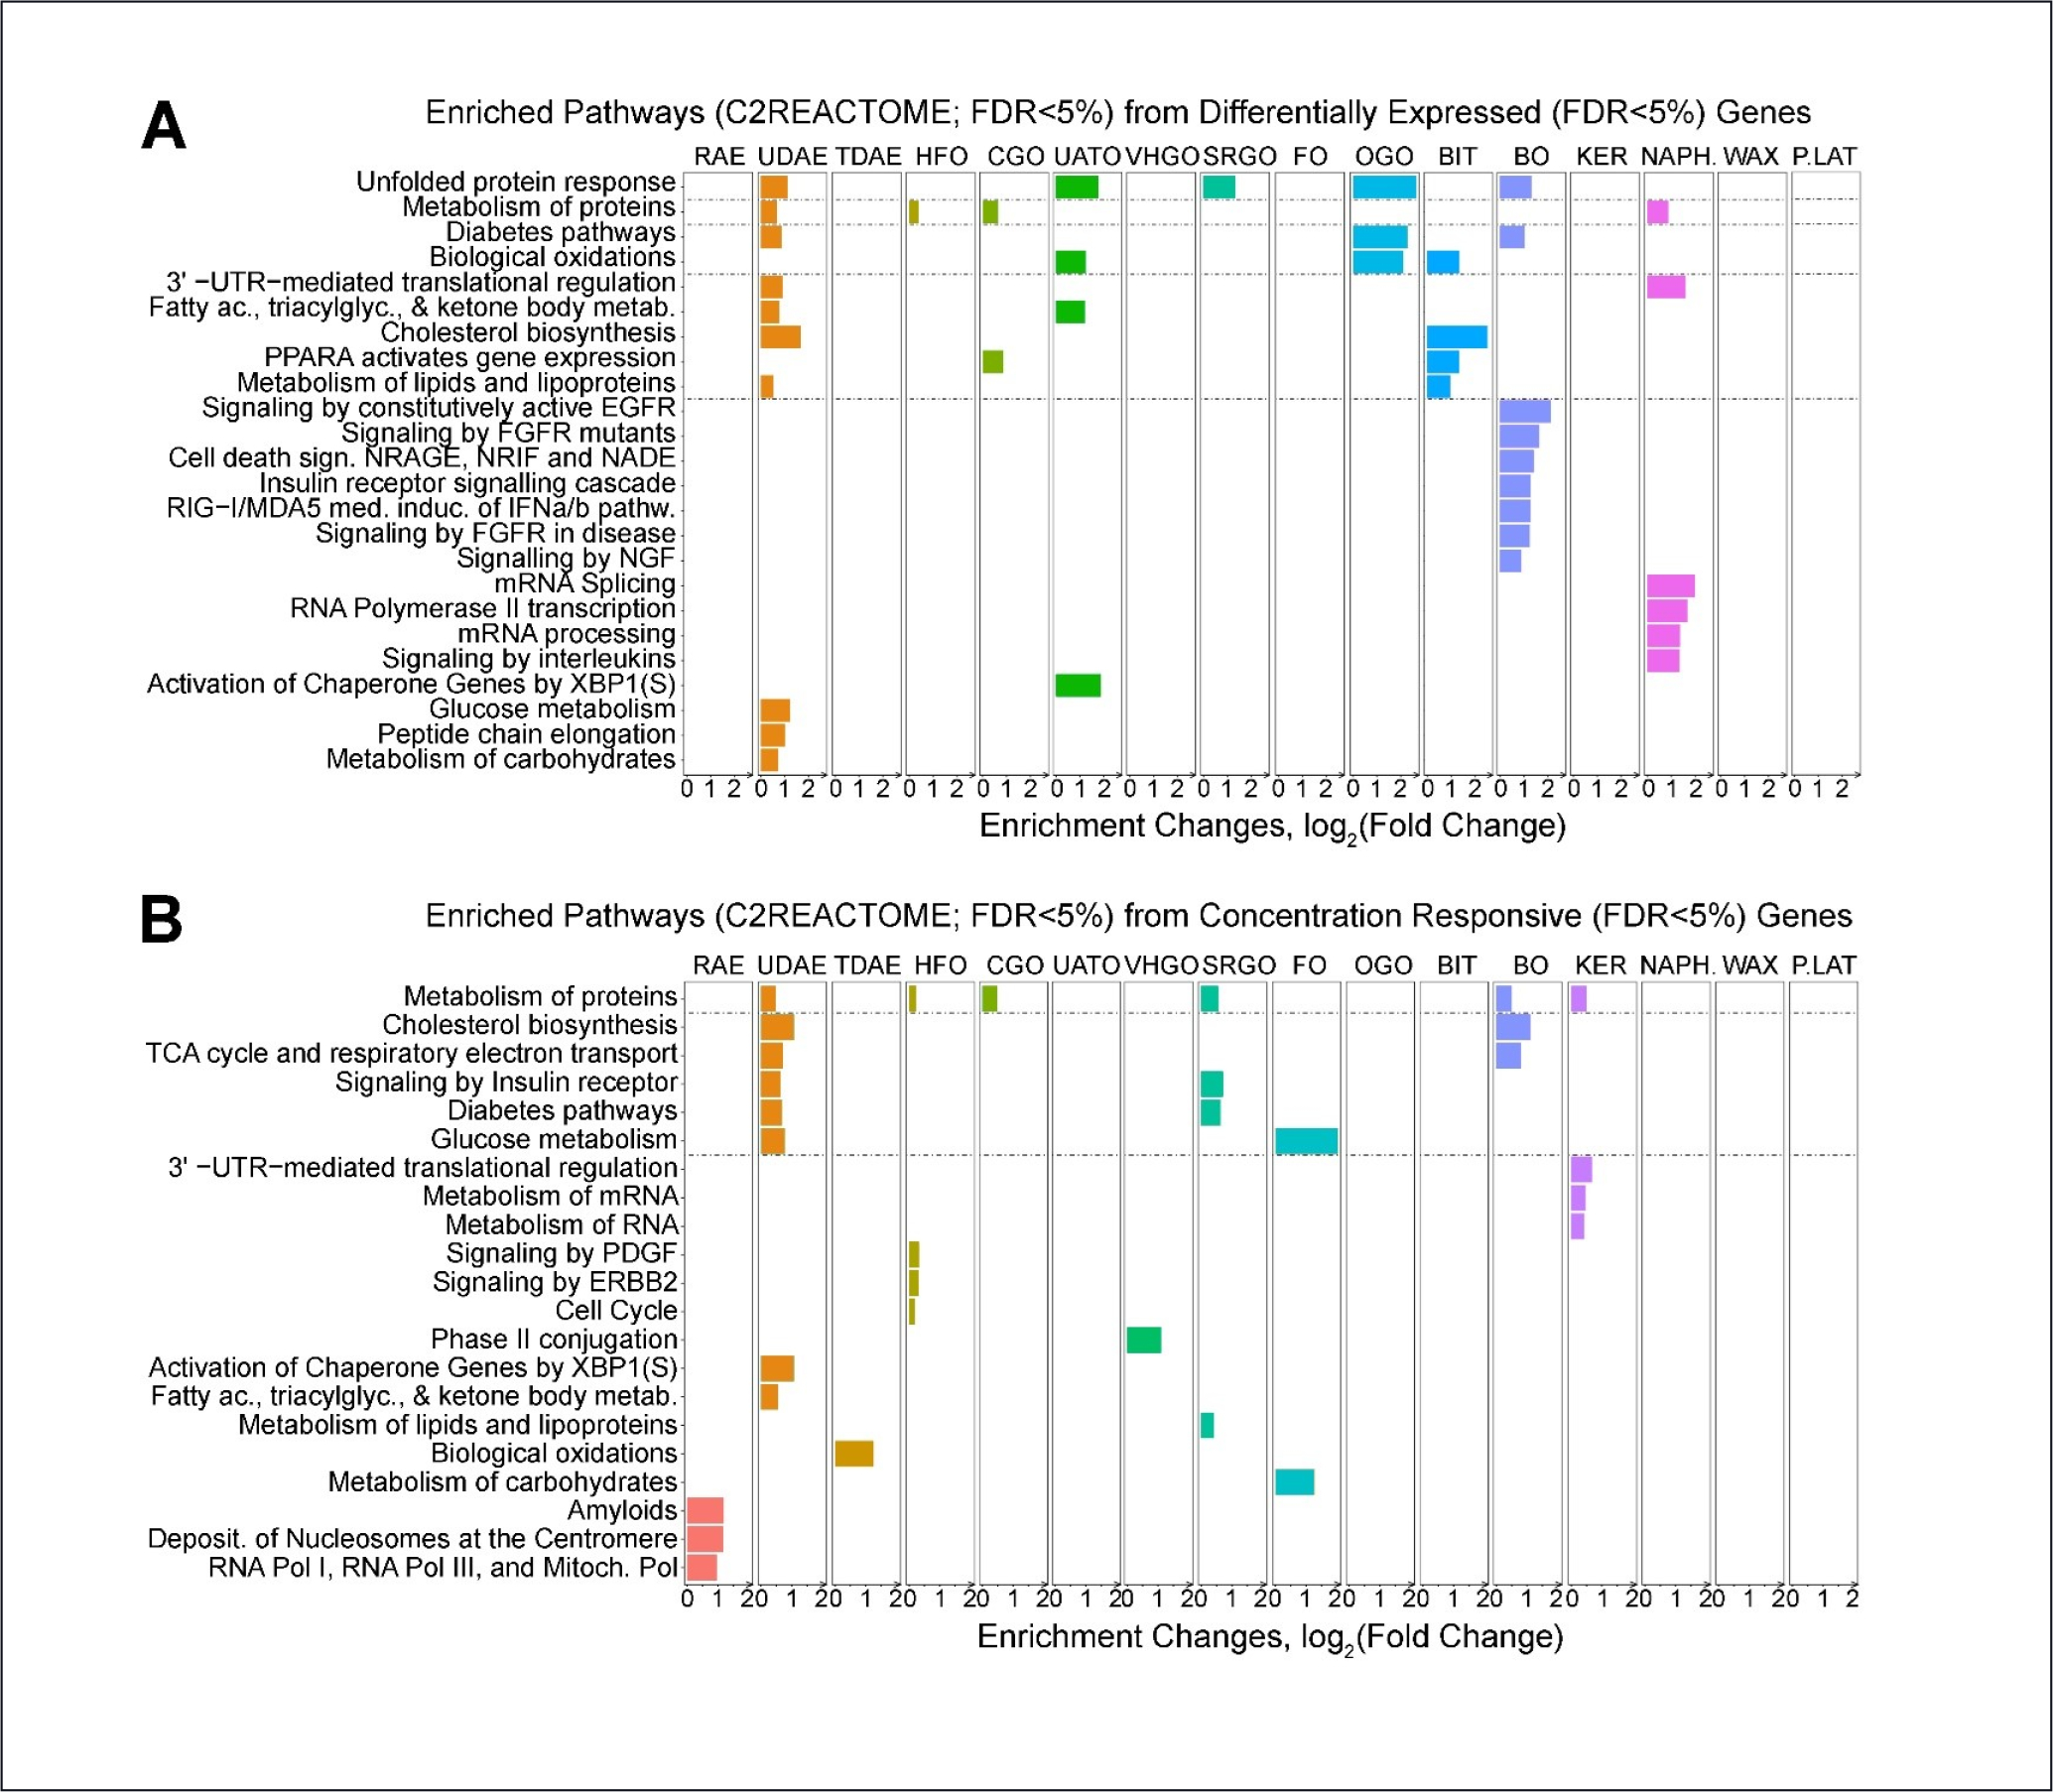
Fig. 4: Class-specific effects of petroleum substances on pathway enrichment (xgr package) in gene expression data from iPSC-derived hepatocytes.

A false discovery q threshold of 0.05 was used for the gene set selection. For pathway enrichment, another false discovery q threshold of 0.05 on the pathway selection was used. Bar plots show enriched pathways (C2Reactome) at FDR ≤ 5% derived using either differentially expressed genes (A, DEG) or concentration-response genes (B, CRG) affected by the substances in each class. In both cases, the gene-level false discovery of q ≤ 0.05 was used. Shown are all substance classes regardless of whether any pathways were enriched. Pathways are ranked by the degree of overlap among classes. The same data for other cell types are shown in Figures S5 and S61.
