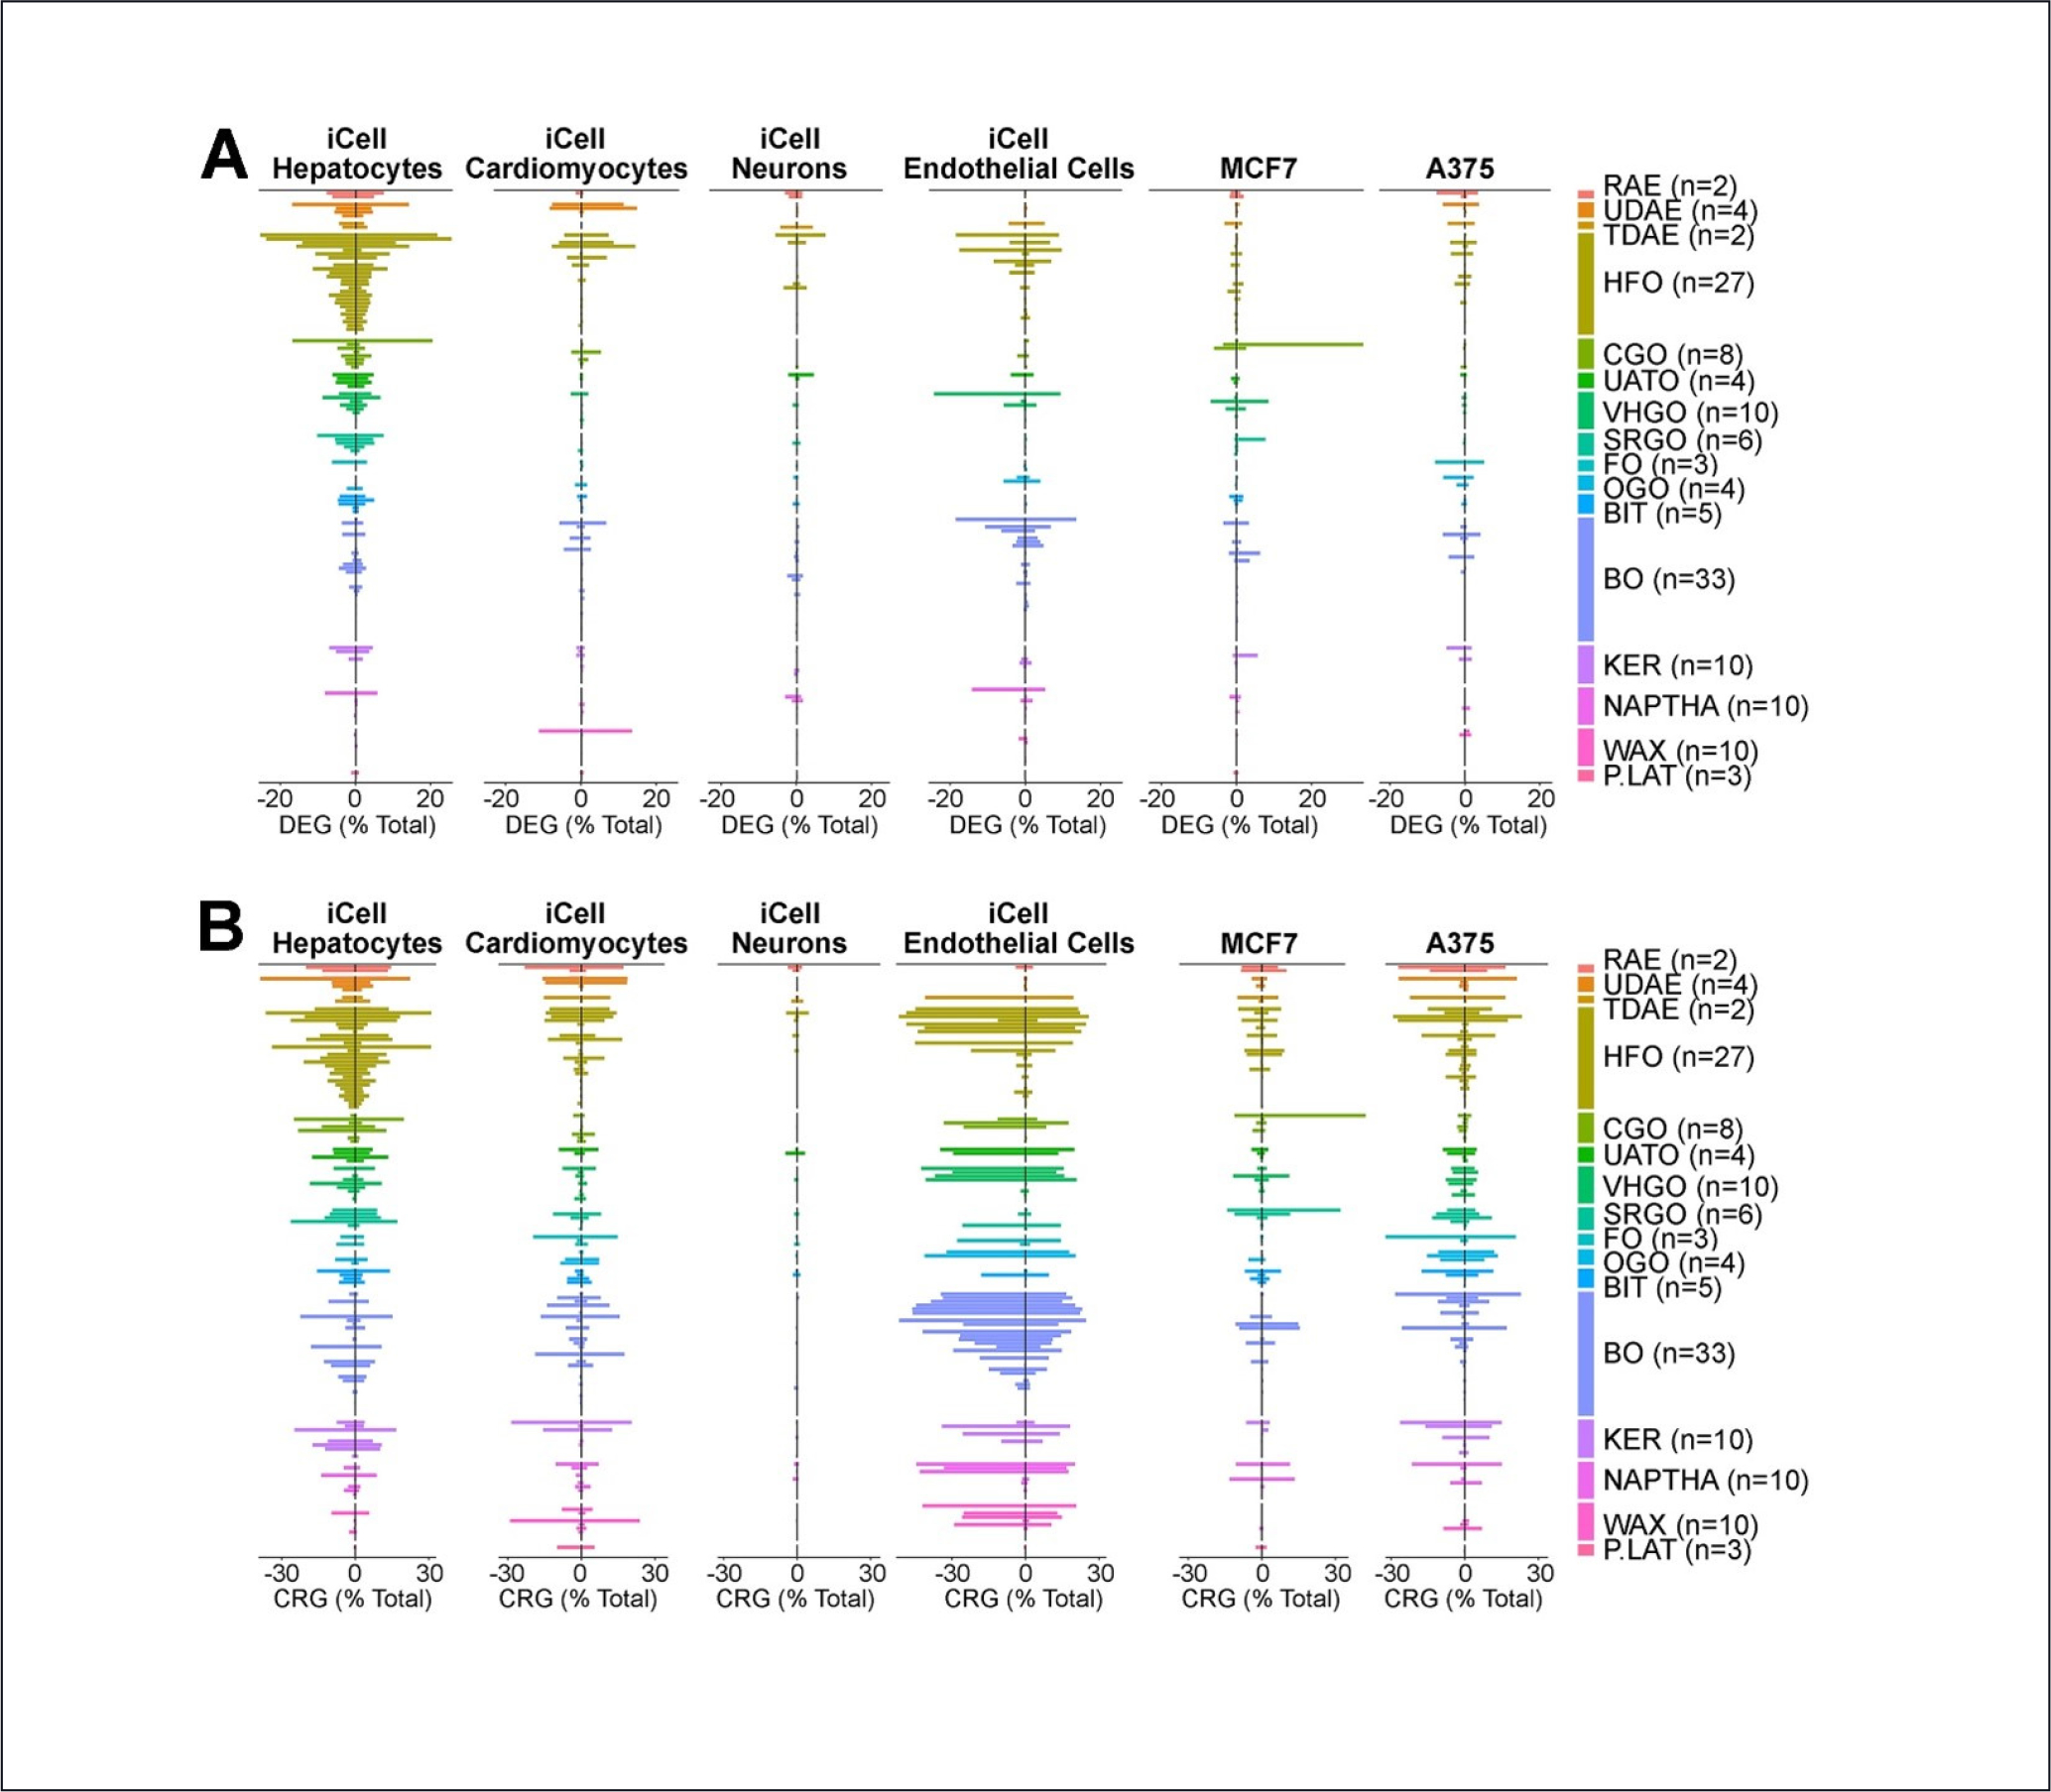
Fig. 5: Heterogeneity of the effects of petroleum substances in the multi-cell in vitro transcriptomic analysis – cell-specific effects.

Two-sided bar plots show the percent of genes significantly (false discovery q ≤ 0.1) affected (either up- or downregulated) by the substances in each class (numbers in each class shown as n). Within class, substances are ranked (top to bottom) based on their cumulative effect across all 6 cell types. (A) Differentially expressed genes (DEG) were derived by comparing expression between the highest concentration of each substance with that in vehicle-treated cells. (B) Concentration-response genes (CRG) were derived by analyzing the slope in gene expression trend with increasing concentration.
