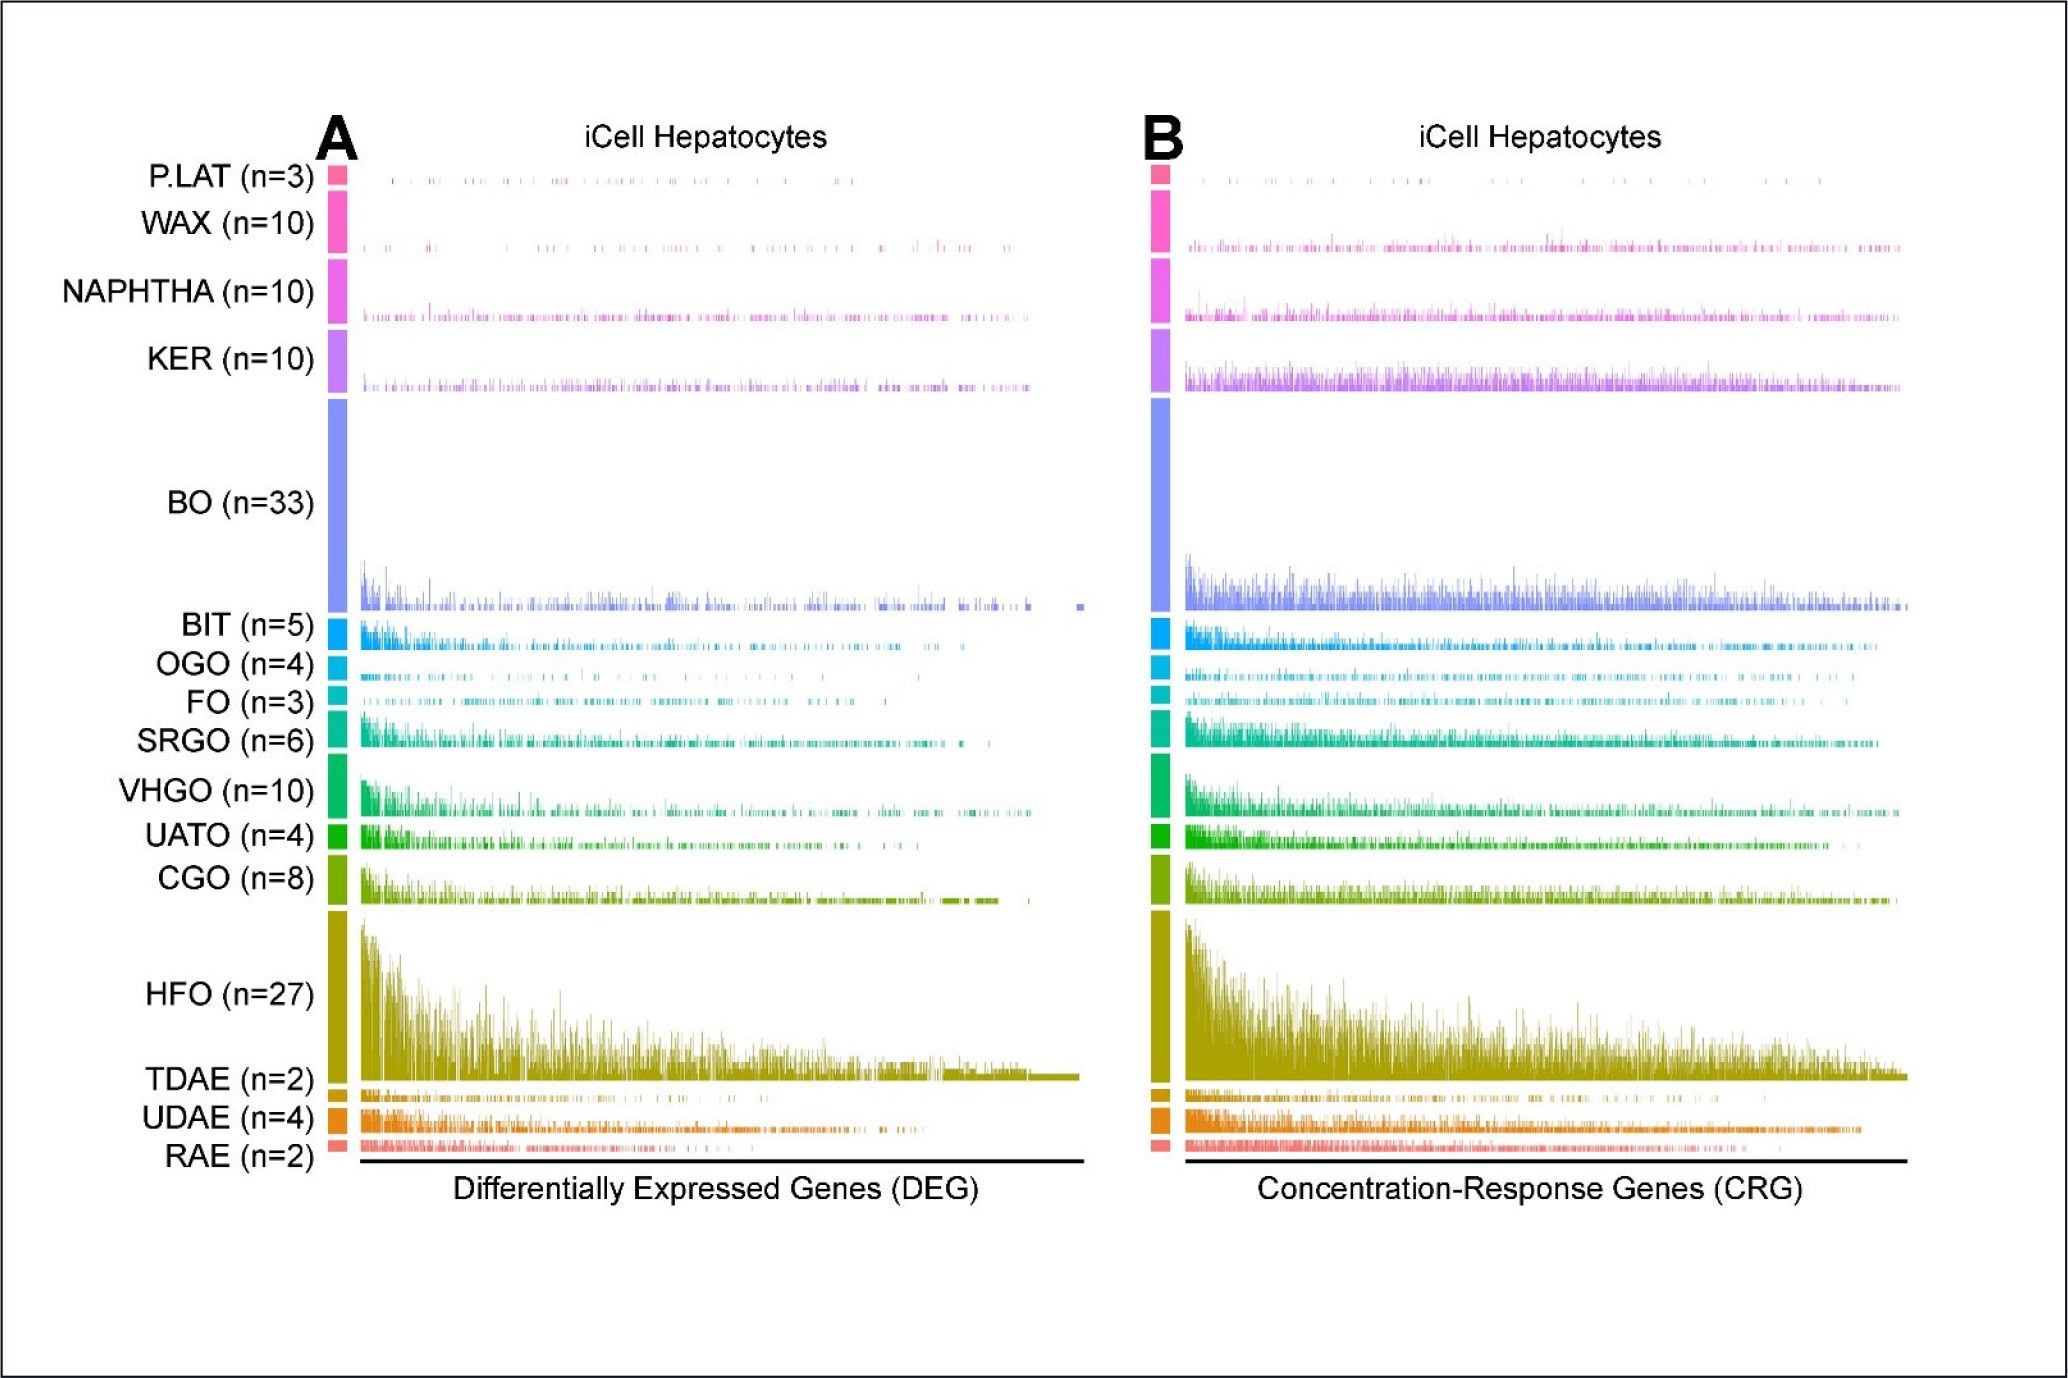
Fig. 6: Heterogeneity of the effects of petroleum substances in the multi-cell in vitro transcriptomic analysis.

In the hepatocyte example, 2388 genes were assessed for DEGs and CRGs (false discovery q < 0.1) after removal of low-count genes. Each vertical line represents one of these genes, ordered left to right as genes most perturbed across all 141 evaluated substances. The height of each bar represents the proportion of times within the UVCB class (numbers in each class shown as n) the gene was either differentially expressed (A) or exhibited a concentration response (B).
