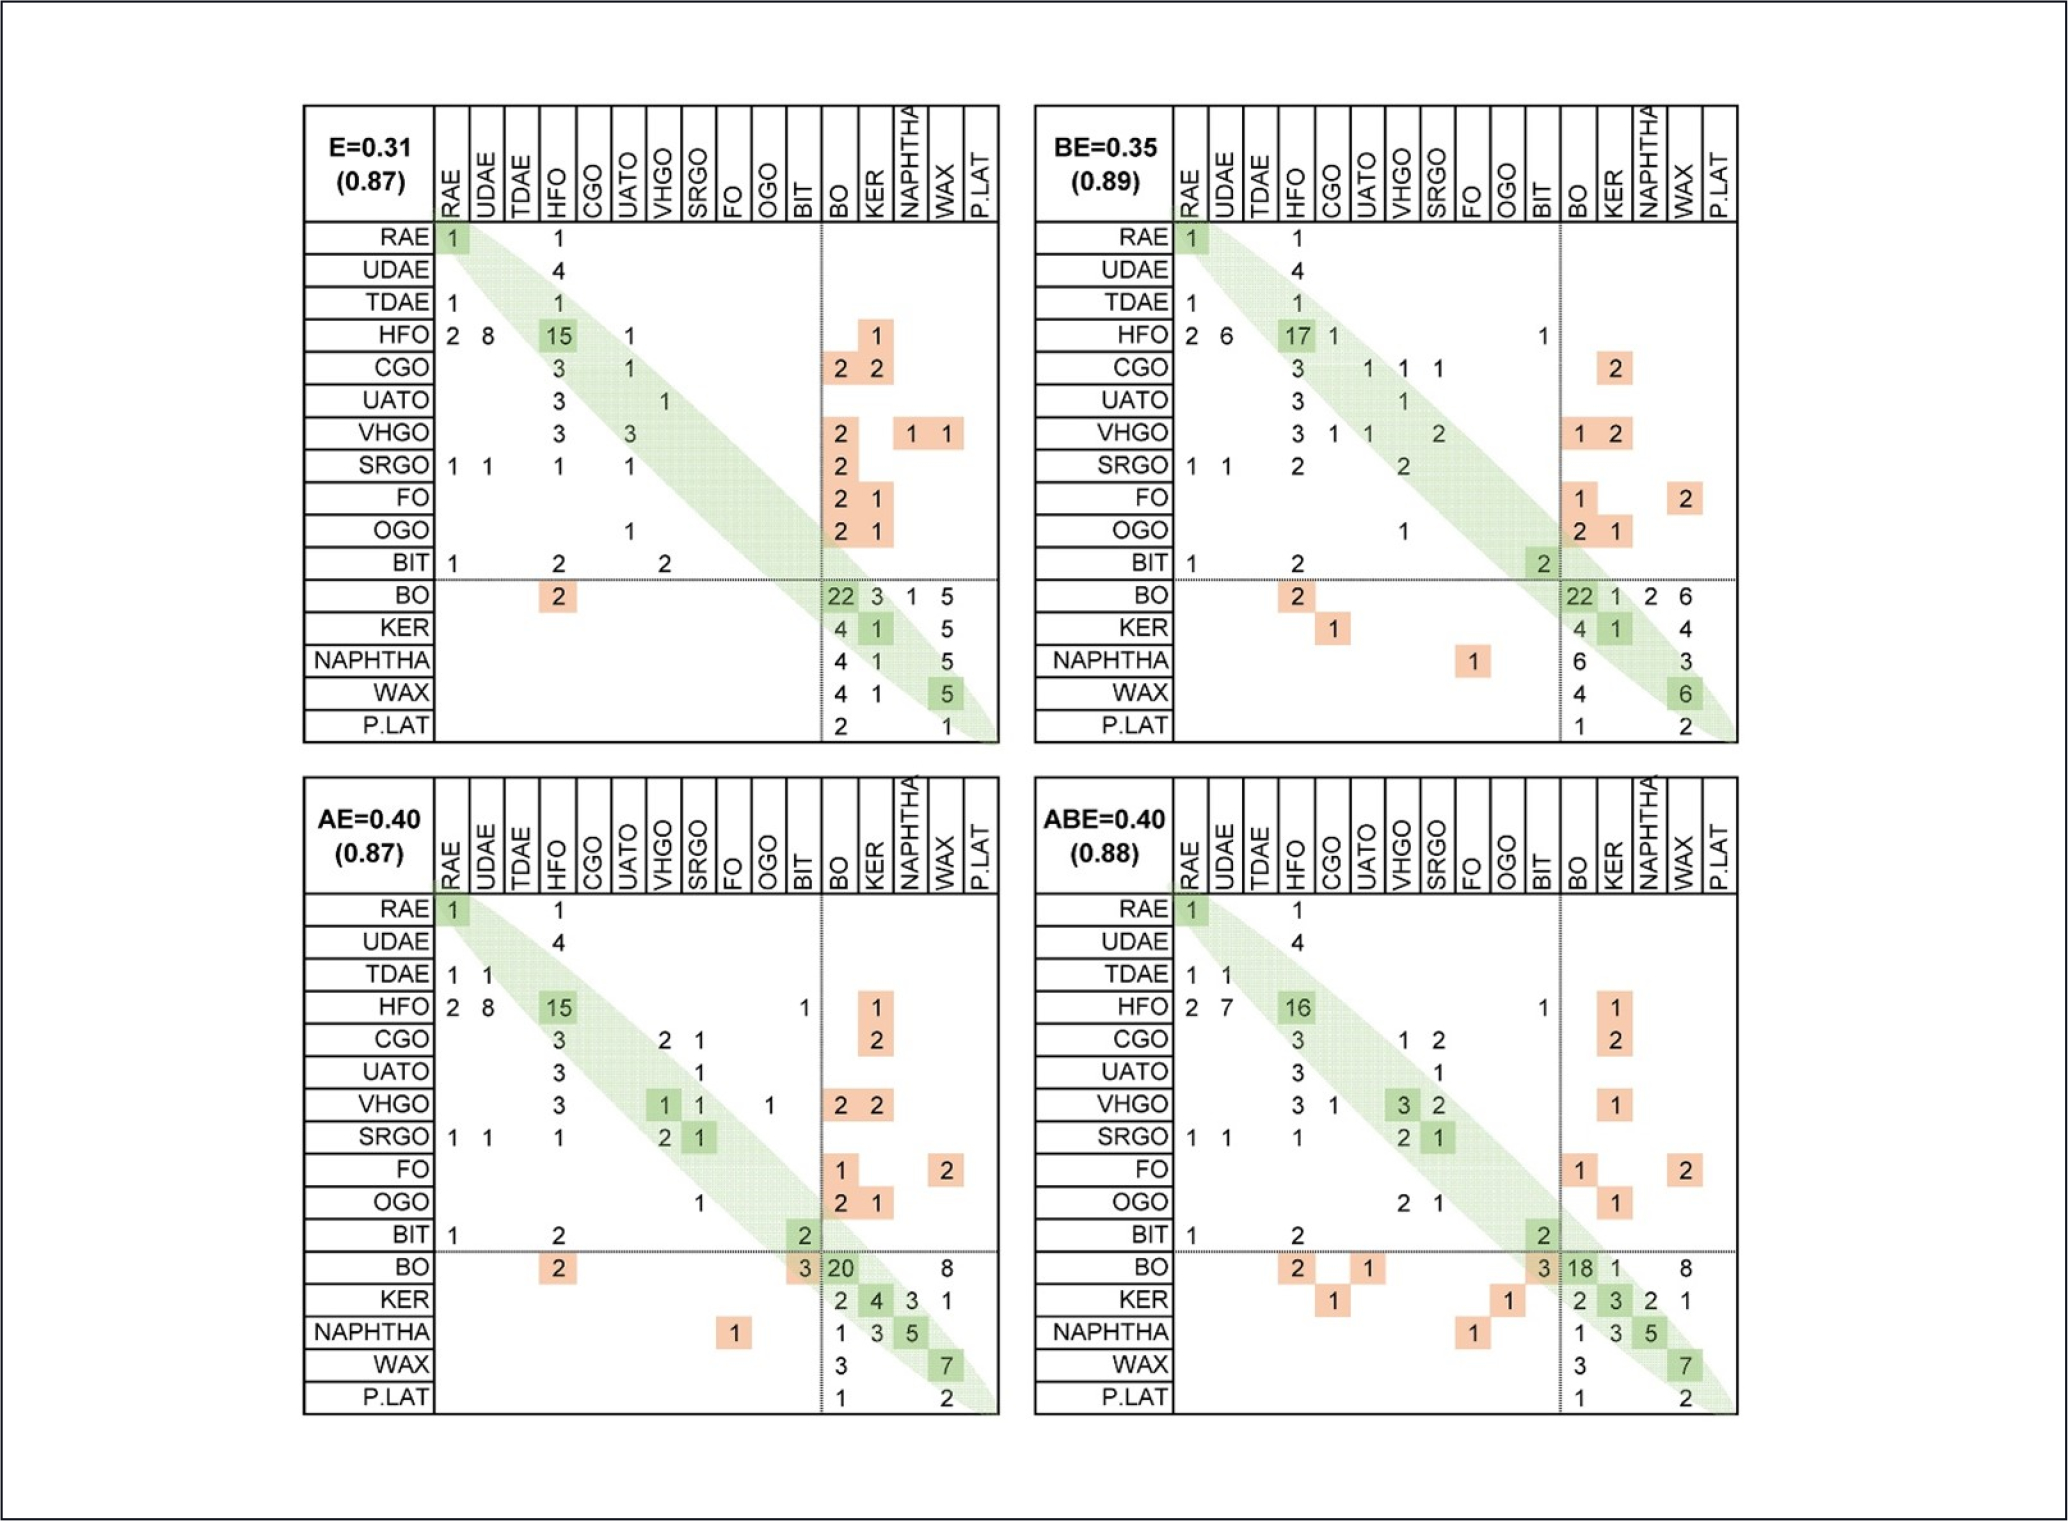
Fig. 8: Analysis of the relationship between gene expression data (iCell hepatocytes, “E”), analytical data (PAC, “A”), and summarized bioactivity data (from House et al., 2021, “B”).

Top left (E): The results of supervised analysis in which the UVCB category is predicted from the pattern of gene expression data in iCell hepatocytes using the PAM classification procedure as described in Section 2. Rows refer to the true category and columns to predicted category. Correct classification counts are colored in green as values on the diagonal. Categories are ordered according to median bioactivity score, so misclassifications near the diagonal (not colored) are not severe, while misclassifications into categories with substantially different hazard profiles are colored in orange. Top right (BE): correct classifications and misclassifications using both expression and bioactivity patterns. Bottom left (AE): correct classifications and misclassifications using both expression and analytic data. Bottom right (ABE): correct classifications and misclassifications using expression, bioactivity, and analytic data. Numbers in top left corner of each matrix are correct classification rate when only exact matches are considered or (in parenthesis) when misclassifications fall into a hazard category that is not substantially different (P.LAT to BO, or BIT to RAE).
