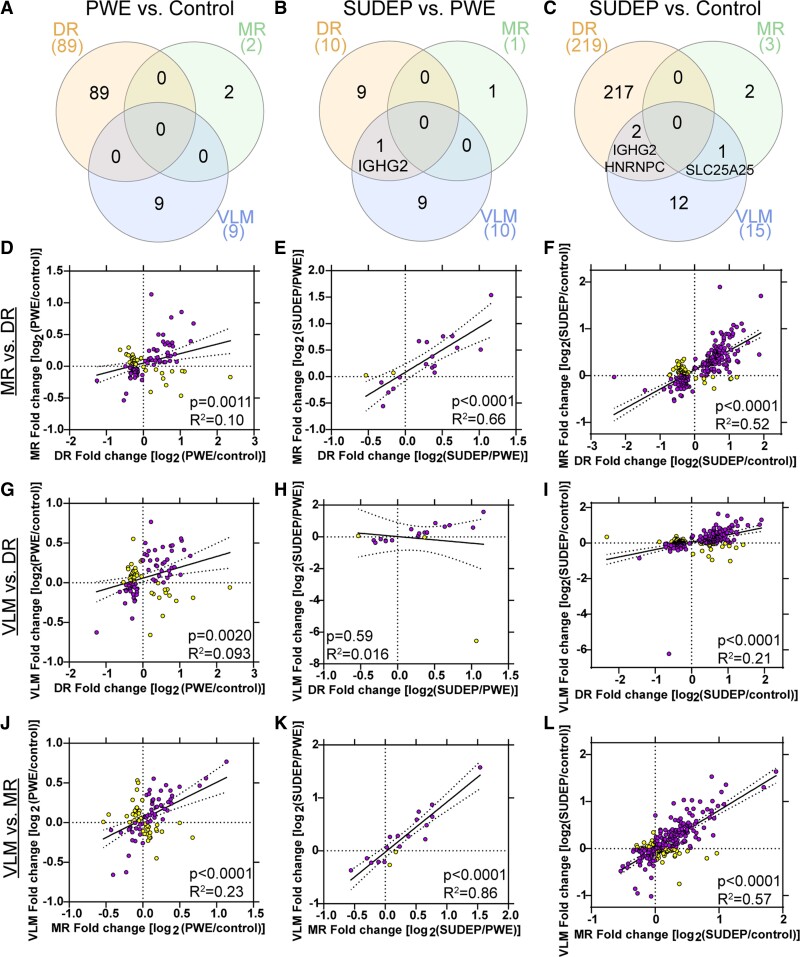
Figure 5.
Brainstem regional overlap of differentially expressed proteins. Regional overlap of differentially expressed proteins after a one-way ANOVA with q value correction followed by a Tukey’s post hoc test. (A) When comparing PWE and control, there are no commonly significant proteins among the three regions analyzed. (B) When comparing SUDEP and PWE, there is one protein (IGHG2) that is increased in SUDEP in both the DR and VLM. (C) When comparing SUDEP and control, there are two proteins (IGHG2 increased, HNRNPC decreased) that are altered in both the DR and VLM. SLC25A25 is also increased in SUDEP in both the MR and VLM. (D–L) Correlation analyses between the various brainstem regions of all significant proteins, with included nuclei indicated on the left. (D, G and J) Correlation analyses indicated that the 100 significant proteins across all brainstem regions in PWE versus control were significant when comparing DR versus MR, DR versus VLM and MR versus VLM. (E, H and K) Correlation analyses indicated that the 20 significant proteins across all brainstem regions in SUDEP versus PWE were significant when comparing DR versus MR and MR versus VLM. There was no correlation in DR versus VLM, due to the difference in expression for LRRC15. This protein is detected in fewer cases in both of these regions, and it is not detected in the MR. (F, I and L) Correlation analyses indicated that the 234 significant proteins across all brainstem regions in SUDEP versus control were significant when comparing DR versus MR, DR versus VLM and MR versus VLM. In purple are the proteins with a fold change in the same direction and in yellow are proteins with a fold change in the opposite direction.

