FIGURE 1.
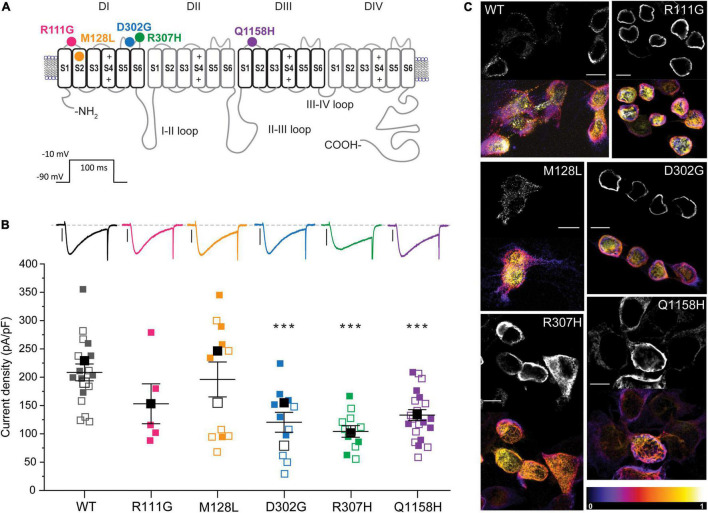
Location and functional expression of Cav3.3 HM-associated variants. (A) Schematic representation of the Cav3.3 channel protein and location of the HM-associated variants functionally characterized. Modular architecture of Cav3.3 showing the four homologous domains (DI–DIV). Each domain is composed of a voltage sensor module (transmembrane segments S1–S4) and a pore module (S5, a re-entrant pore loop and S6). The locations of the amino acids changed by HM-associated rare variants are marked with circles. Color scheme maintained hereafter: R111G ( ), M128L (
 ), D302G (
 ), R307H (
 ), and Q1158H (
 ). (B)
Top: representative whole-cell currents from Cav3.3 WT and HM-associated variants R111G (fuchsia), M128L (orange), D302G (blue), R307H (green), and Q1158H (purple) expressed in HEK293T cells. Voltage-gated Ca2+ currents were elicited by a 100-ms pulse to −10 mV (Vh: −90 mV, inset). Scale bars: 1 nA. Bottom: summary of current density calculated from peak current amplitude (Ipeak/cell capacitance in pA/pF). In this and subsequent SuperPlots (Lord et al., 2020), individual values and mean ± SEM (calculated from all data points in each group) are shown. Biological variabilities from independent transfections and recording time points are conveyed by different symbols. Within biological replicates, empty symbols correspond to determinations made 24 h post-transfection (□: mean 24 h), and solid symbols correspond to 48 h post-transfection recordings (■: mean 48 h). The statistical significance was determined through a paired Student’s t-test against Cav3.3 WT. p ≤ 0.001 (***), 0.001 < p ≤ 0.01 (**), or 0.01 < p ≤ 0.05 (*). (C) Confocal micrograph from immunostained Cav3.3 WT and variants (indicated by the corner labels) showing distinct expression patterns. Paired images of Alexa 488 fluorescence of center stack (top) and the depth-encoded full stack sets are shown for each construct. The color scale (bottom right) indicates relative distance from the coverslip. DAPI nuclear stain is not shown here for clarity, see Supplementary Figure 1A. Scale bar 10 microns.

