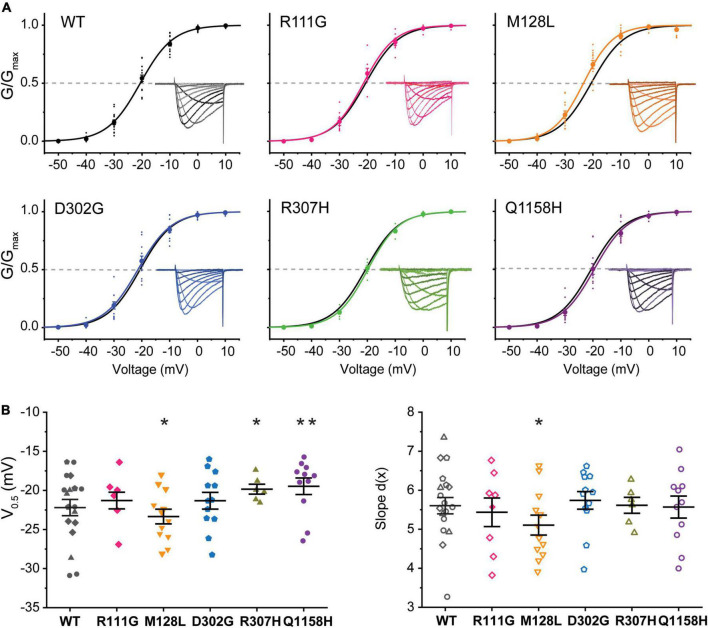
FIGURE 2.
Voltage dependence of activation of Cav3.3 WT and HM-associated variants. (A) Normalized conductance (G/Gmax) vs. voltage relationships for Cav3.3 and HM variants. Representative current families are included as insets. Dotted lines are drawn at G/Gmax = 0.5 to highlight the voltage of half-maximal activation (activation V0.5). (B) SuperPlots of activation V0.5 and slope [d(x)]. Symbols represent determination made from cells transfected on the same day (i.e., biological replicates). 0.001 < p < 0.01 (**), 0.01 < p 0.05 (*).

