
Fig 1. Characterization of DS hiPSC-derived PMPs.
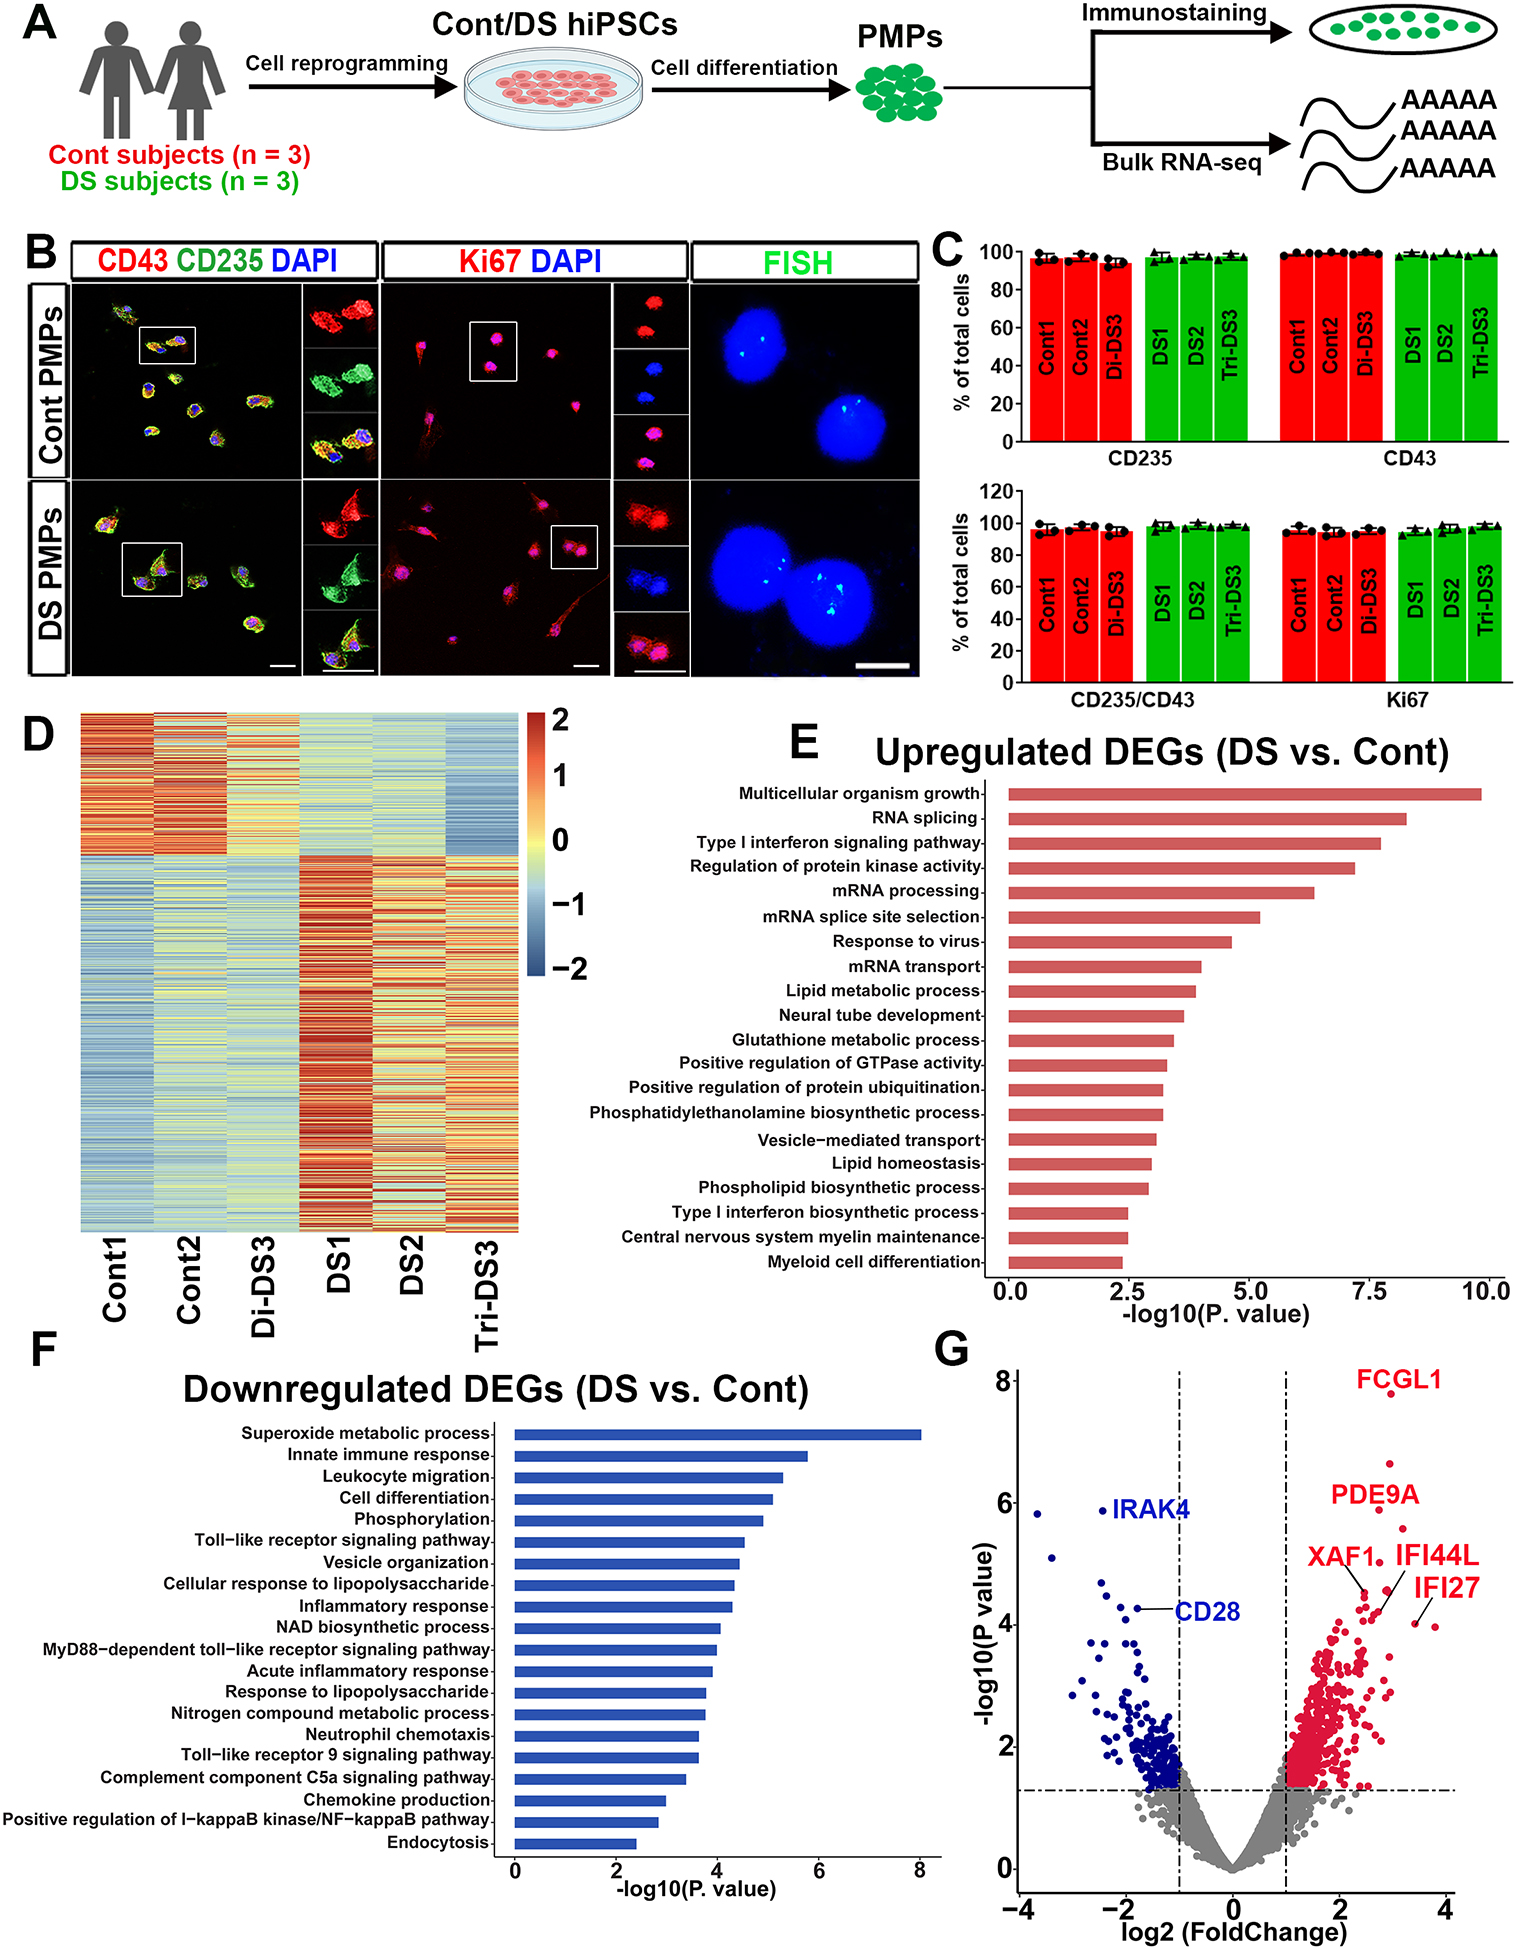
(A) Schematic representation of the generation and characterization of PMPs. This drawing was created using BioRender.com.
(B) Representative images of CD235+, CD43+, Ki67+ cells, and FISH analysis in PMPs. Scale bars: 20 μm,10 μm, and 5 μm.
(C) Quantification of CD235+, CD43+, CD235+/CD43+, and Ki67+ PMPs derived from the three pairs of Cont and DS hiPSC lines (n=3).
(D) The heatmap showing all DEGs between Cont and DS PMPs.
(E-F) GO analyses of the upregulated and downregulated DEGs in the PMPs.
(G) A volcano plot illustrating downregulated (blue) and upregulated (red) DEGs in PMPs.