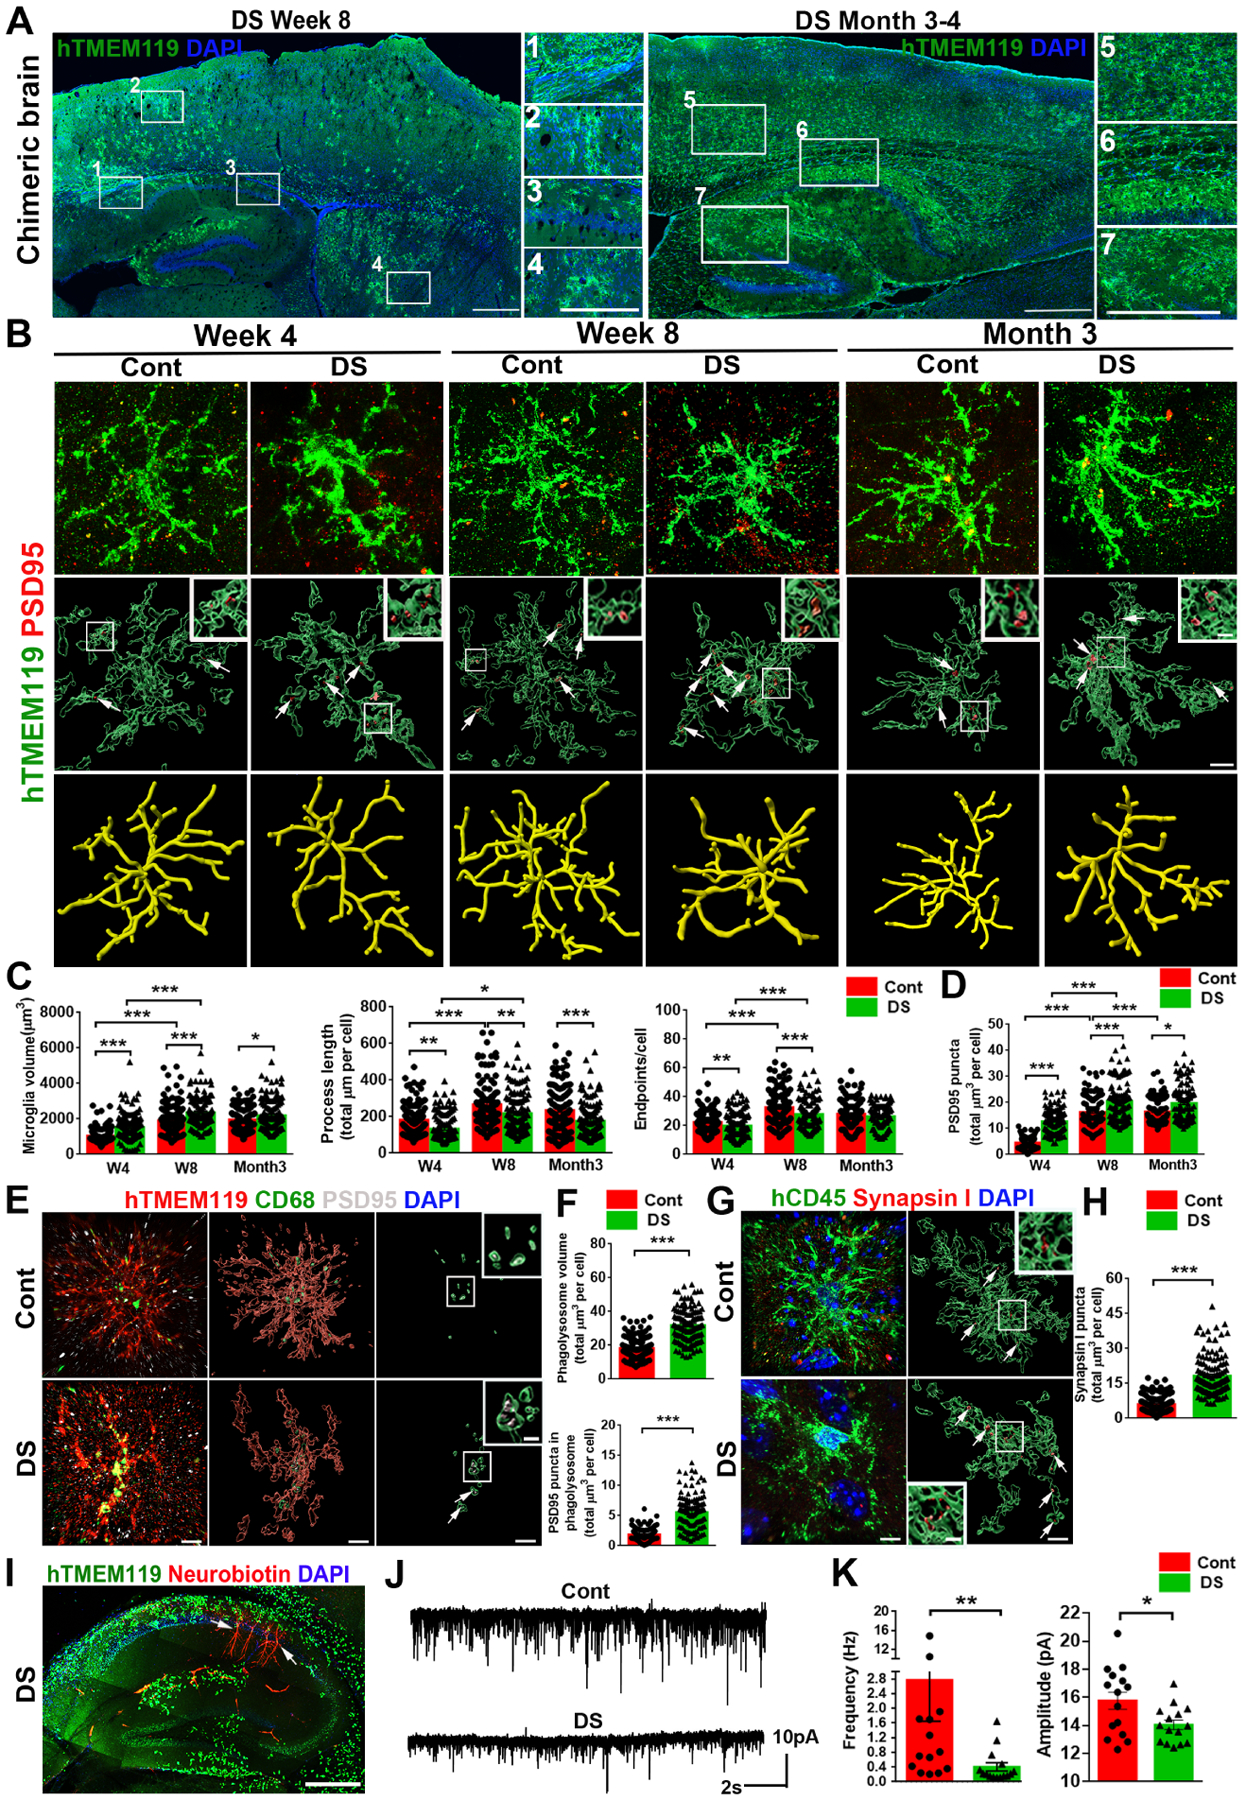
Fig 3. Modeling DS microglial phenotypes in human-mouse microglial chimeras.

(A) Representative images from sagittal brain sections showing the distribution of transplanted DS hiPSC-derived microglia at week 8 and 3 to 4 months. Scale bar: 1 mm and 500 μm.
(B) Representative images showing colocalization of hTMEM119+ and PSD95+ staining at 4, 8 weeks, and 3 months post-transplantation. Arrows indicate PSD95+ puncta. Scale bar: 5 μm and 1μm.
(C, D) Quantification of microglial volume, process length, endpoints, and PSD95+ puncta inside microglia (n=120–160 microglia from 3–5 mice/group).
(E) Representative images showing colocalization of hTMEM119+CD68+ PSD95+ staining of week 8 chimeras. Arrows indicate PSD95+ puncta in the CD68+ phagolysosome. Scale bar: 5 μm and 1 μm.
(F) Quantification of CD68+ phagolysosome volume and PSD95+ puncta inside CD68+ phagolysosomes (n=120 microglia from 4 mice/group).
(G) Representative images of hCD45 and synapsin I staining in week 8 of chimeras. Arrows indicate synapsin I+ puncta. Scale bar: 5 μm and 1 μm.
(H) Quantification of synapsin I+ puncta in hCD45+ microglia (n=120 microglia from 4 mice/group).
(I) A representative image of hTMEM119+ microglia and Neurobiotin+ recorded neurons in the hippocampus of DS microglia chimera. Arrows indicate Neurobiotin+ recorded neurons. Scale bar: 500 μm.
(J) Representative traces of mEPSCs in CA1 hippocampal pyramidal neurons.
(K) Quantification of the frequency and amplitude of mEPSCs (n=14–15 neurons from 4–5 mice/group).
Student’s t test, *P < 0.05 and **P < 0.01. Data are presented as mean ± SEM.
