
Fig 5. scRNA-seq analysis of DS microglial chimeras receiving injection of Cont or pathological DSAD tau.
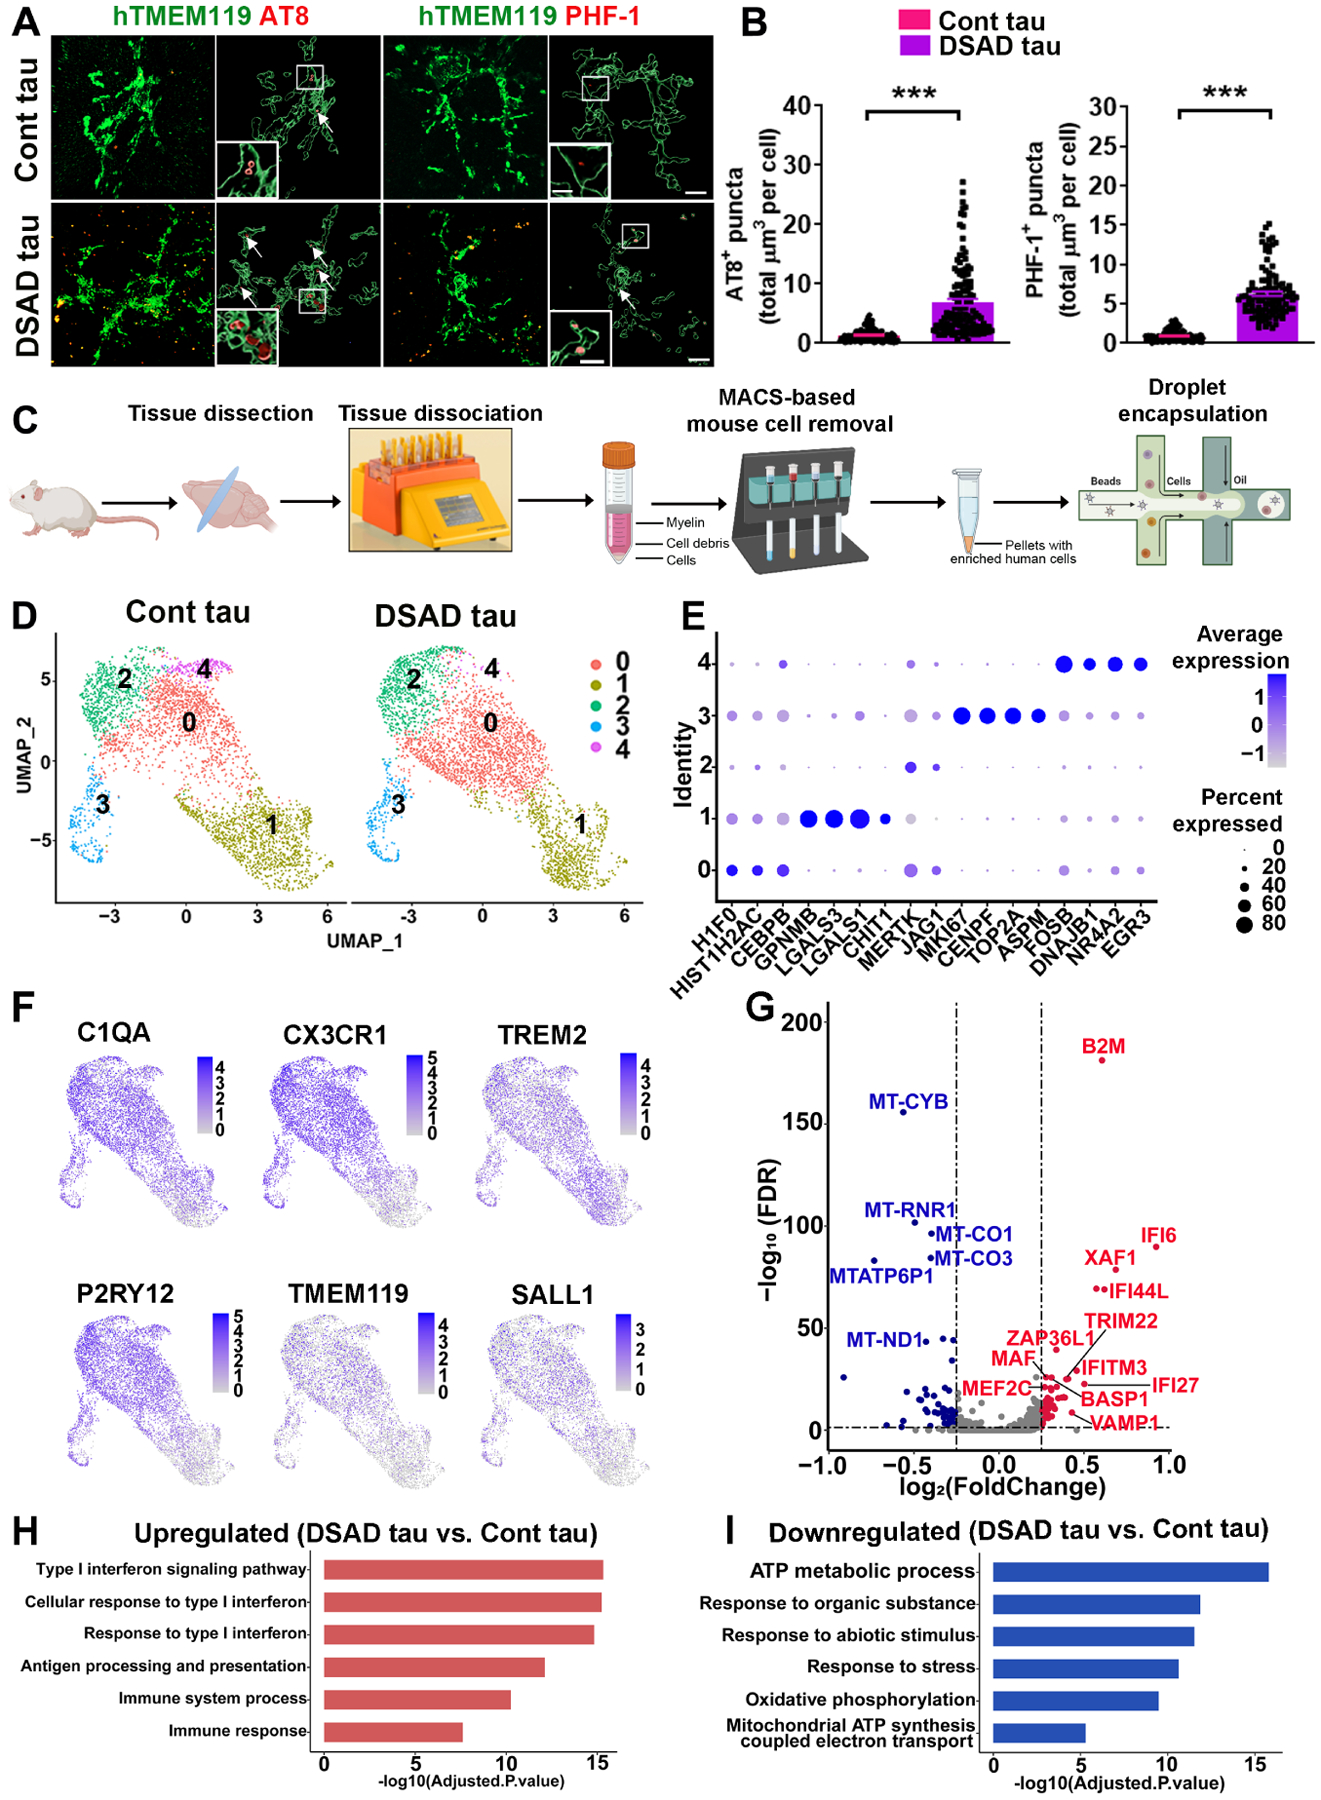
(A) Representative images of hTMEM119, AT8, and PHF-1 staining in 4 to 5-month-old chimeras receiving injection of Cont or DSAD tau at 8 weeks. Arrows indicate AT8+ or PHF-1+ p-tau. Scale bars: 7 μm and 3 μm.
(B) Quantification of AT8+ and PHF-1+ p-tau in microglia (n=110–127 from 3–4 mice/group).
(C) A schematic diagram showing the design of the scRNA-seq experiment. This drawing was created using BioRender.com.
(D) A UMAP plot showing independent subclusters (clusters 0–4) from Cont and DSAD tau groups.
(E) A dot plot showing the representative conserved markers from each subcluster.
(F) UMAP plots with dots (representing cells) colored by the expression levels of human microglial genes.
(G) A volcano plot illustrating downregulated (blue) and upregulated (red) DEGs.
(H, I) GO enrichment analyses of the upregulated and downregulated DEGs.
Student’s t test, ***P < 0.001. Data are presented as mean ± SEM.