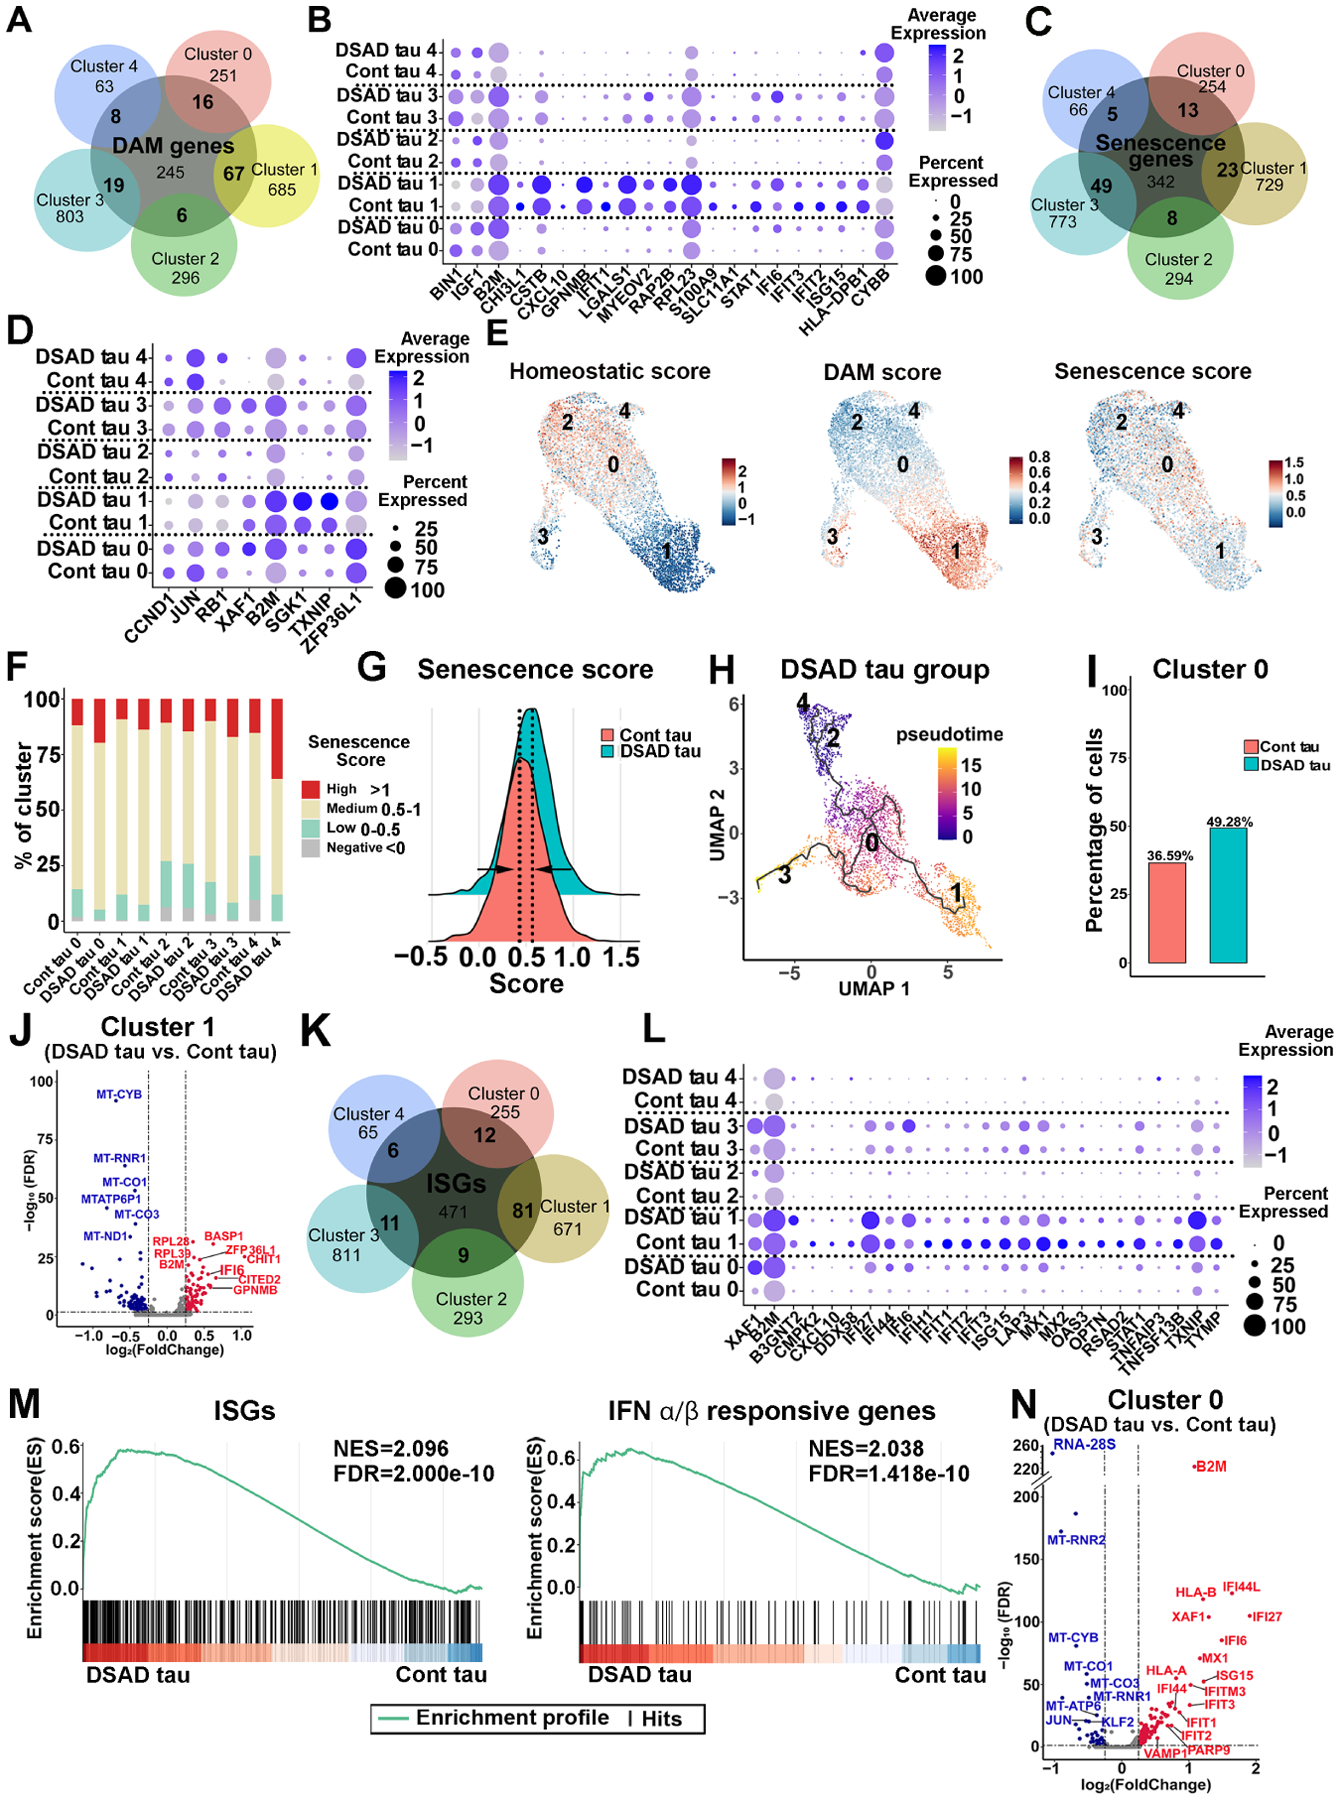
Fig 6. Pathological tau induces DAM, senescence, and ISG signatures in DS microglia.

(A) A Venn diagram showing the overlap between DAM genes and the gene markers defined from each cluster.
(B) A dot plot representing the expression of DAM DEGs in each cluster from the Cont and DSAD tau groups.
(C) A Venn diagram showing the overlap between senescence genes and gene markers defined from each cluster.
(D) Dot plot showing the DEGs expression of the senescence genes signature in every subcluster from DSAD tau and Cont tau groups.
(E) Feature plots showing the scoring of homeostatic, DAM, and senescence signatures.
(F) Bar plots of the percentage of cells with a negative (<0), low (0–0.5), medium (0.5–1), or high (>1) senescence score in the custom senescence signature in each cluster.
(G) A ridge plot showing the senescence score in DSAD and Cont tau groups.
(H) UMAP representation of the trajectory of DS microglia in response to DSAD tau. Cells are colored by pseudotime.
(I) Cell ratios of cluster 0 in the Cont and DSAD tau groups.
(J) A Volcano plot illustrating the downregulated (blue) and upregulated (red) DEGs in cluster 1.
(K) A Venn diagram showing the overlap between ISGs and the gene markers defined from each cluster.
(L) A Dot plot displaying the ISG DEGs in each cluster from the Cont and DSAD tau groups.
(M) GSEA plots showing enrichment of ISGs and IFNα/β responsive genes in DSAD and Cont tau groups (NES: normalized enrichment score, FDR: false discovery rate).
(N) A Volcano plot showing the downregulated (blue) and upregulated (red) DEGs in cluster 0.
