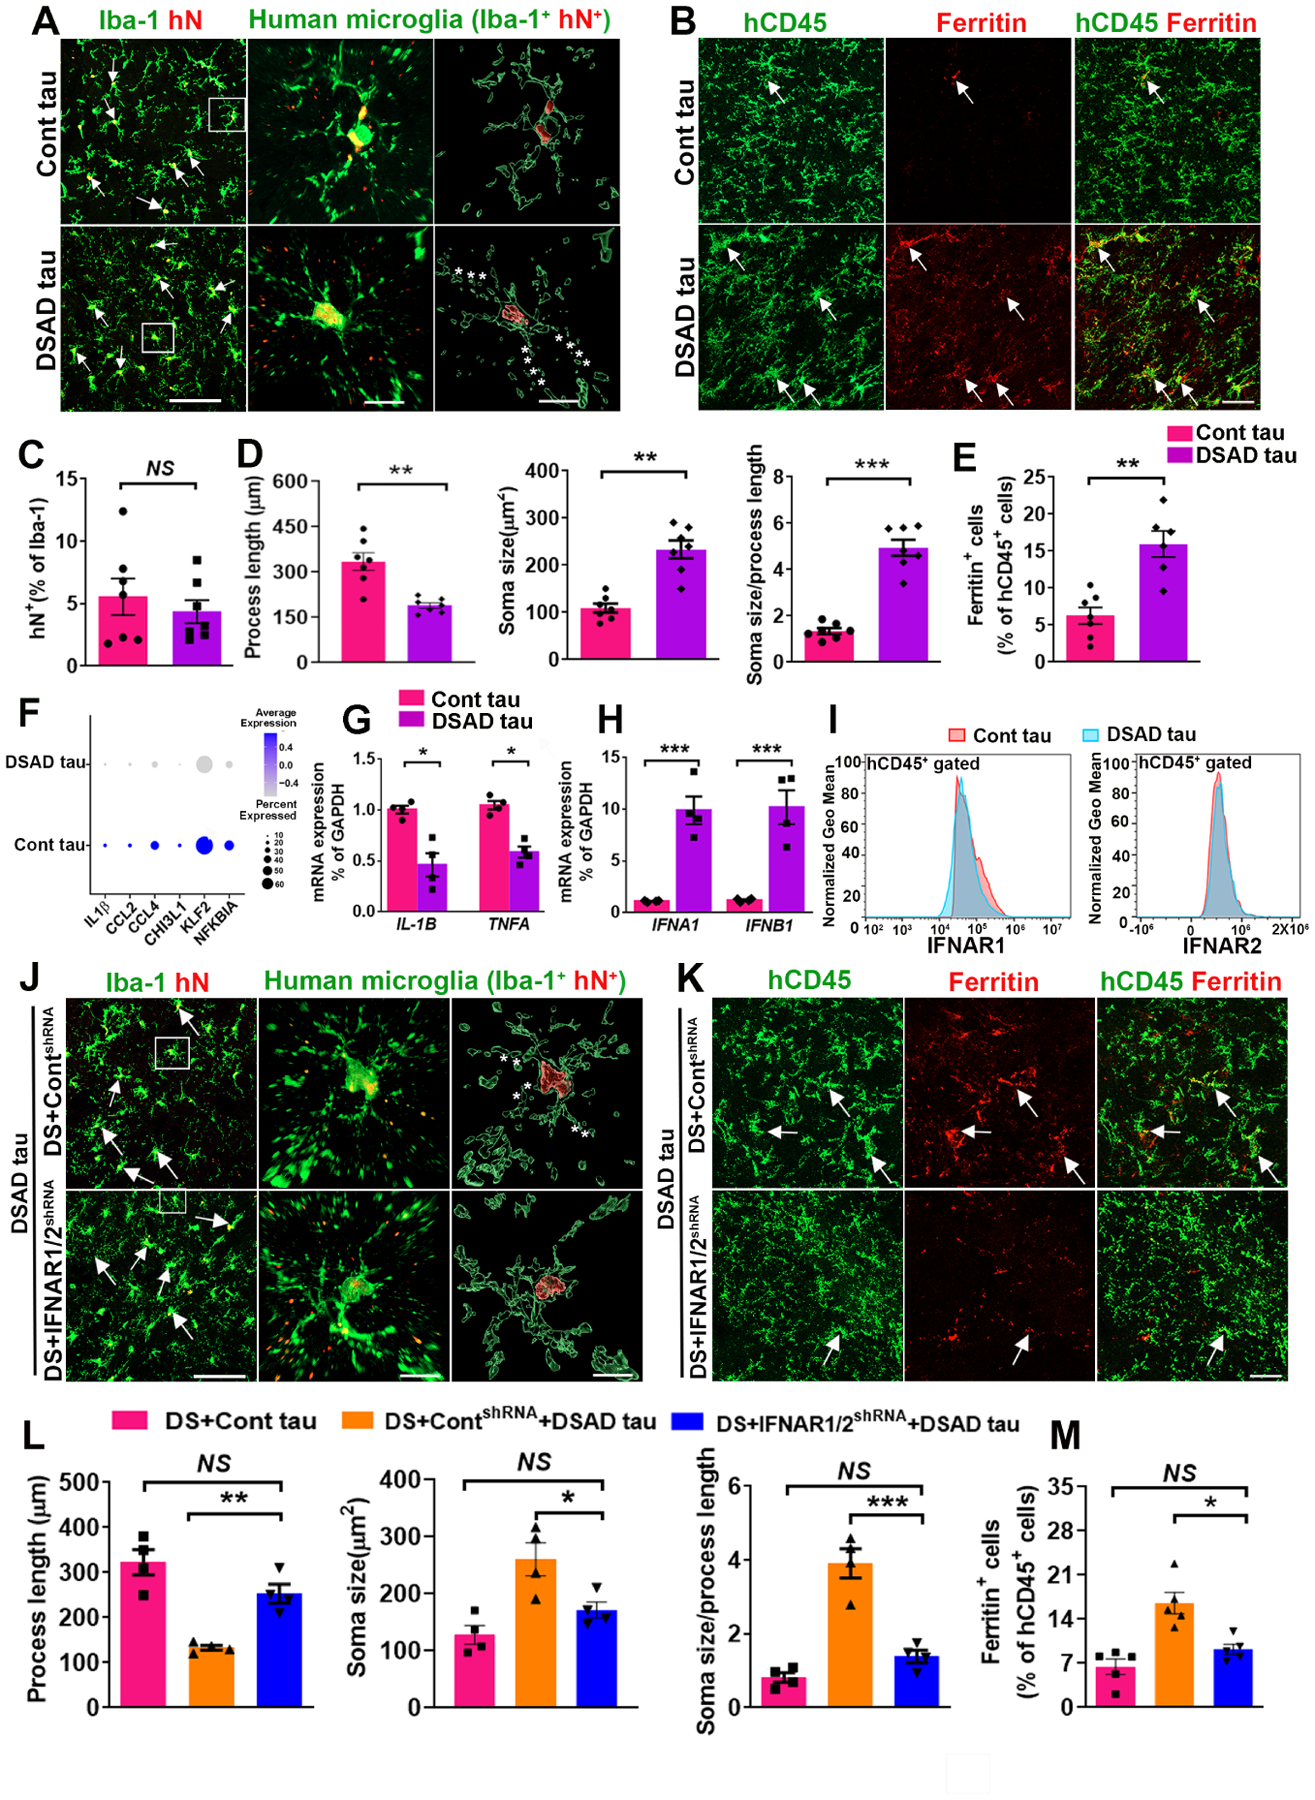
Fig 7. Knockdown of IFNARs rescues pathological tau-induced senescence in DS microglia.

(A) Representative images of Iba+/hN+ human microglia in Cont and DSAD tau groups. Arrows indicate Iba+/hN+ human microglia. Asterisks indicate fragmented processes. Scale bars: 50 μm and 10 μm.
(B) Representative images showing colocalization of hCD45+ and Ferritin+ staining in Cont and DSAD tau groups. Arrows indicate Ferritin+ and/or hCD45+ staining. Scale bar: 50 μm.
(C) Quantification of the percentage of hN+ in Iba-1+ cells (n=7 mice/group).
(D) Quantification of the process length, soma size, and soma size/process length cells (n=7 mice/group).
(E) Quantification of the percentage of Ferritin in hCD45+cells (n=6–7 mice/group).
(F) A Dot plot representing the expression of the inflammation-related genes IL1B, CCL2, CCL4, CHI3L1, KLF2, NFKBIA identified from scRNA-seq.
(G) qPCR analysis of IL-1B and TNFA mRNA expression (n=4 mice/group).
(H) qPCR analysis of IFNA1 and IFNB1 mRNA expression (n=4 mice/group).
(I) Flow cytometry analysis showing the expression of IFNAR1 and IFNAR2 in Cont tau and DSAD tau group (n=2 mice/group).
(J) Representative images of human microglia (Iba+hN+) in chimeras. Arrows indicate Iba+/hN+ human microglia. Asterisks indicate fragmented processes. Scale bar: 50 μm and 10 μm.
(K) Representative image showing colocalization of hCD45+ and Ferritin+ staining in chimeras. Arrows indicate Ferritin+ and/or hCD45+ staining. Scale bar: 50 μm.
(L) Quantification of the process length, soma size, and soma size/process length (n=4 mice/group).
(M) Quantification of the percentage of Ferritin+ in hCD45+ cells (n=5 mice/group).
Student’s t test or One-way ANOVA test, *P < 0.05, **P < 0.01 and ***P < 0.001. Data are presented as mean ± SEM.
