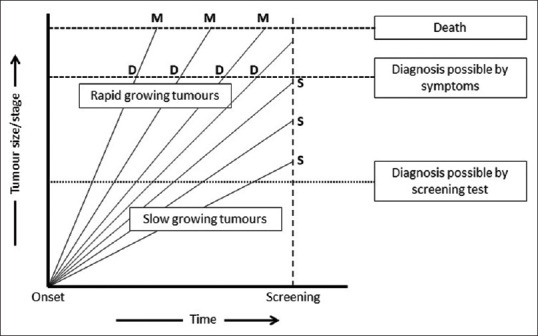
Figure 2.

Length bias. X-axis represents time. Y-axis represents tumor size or stage. The disease onset is at zero and each oblique line represents tumor growth in an individual, with lines on the left for persons with rapid tumor growth and those on the right and bottom for those with slower tumor growth. The persons with rapid growth are diagnosed based on symptoms (D) and die (M) rapidly. By comparison, the individuals with slower growth are more likely to be diagnosed where they get screened (S), and they would live longer
